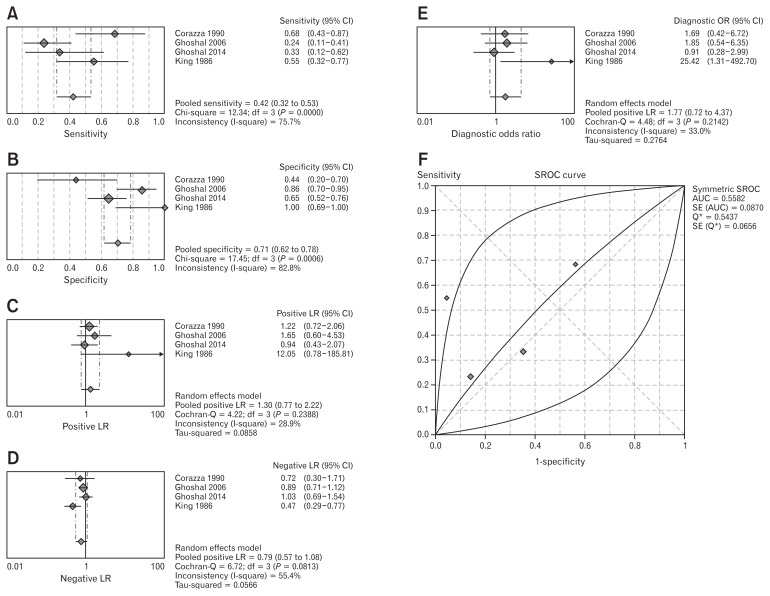
Figure 3.
Forest plot of pooled sensitivity (A), specificity (B), pooled positive (C) and negative (D) likelihood ratio (LR), diagnostic odd ratio (E), and summary receiver operating characteristic (SROC) curve (F) of lactulose breath test for small intestinal bacterial overgrowth diagnosis. AUC, area under the curve.

