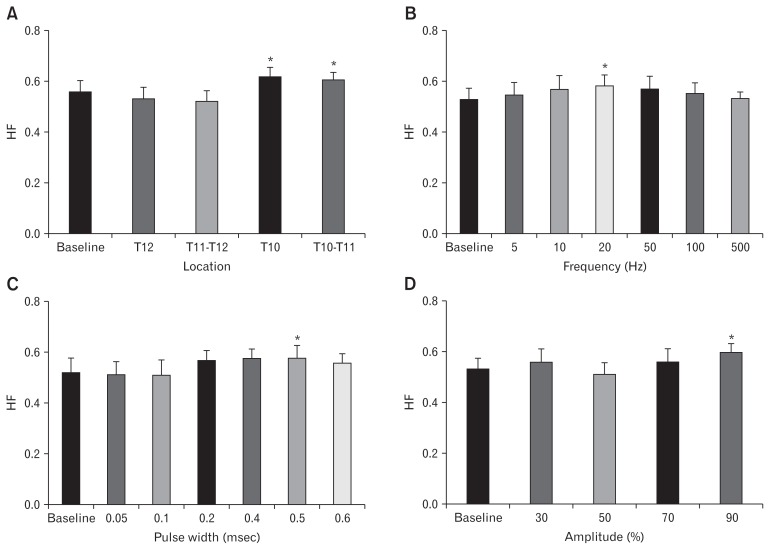
Figure 4.
Validating the best location as well as our optimized parameters of spinal cord stimulation (SCS) by measuring the autonomic functions via employing the spectral analysis of heart rate variability (HRV). High frequency (HF) shown to represent the parasympathetic activity in HRV. (A) Using prior parameters, T10 and T10–T11 showed more increase in parasympathetic activity based on HRV analysis. Subsequently, SCS was performed on T10 to confirm the parameters for the best frequency (B: 5–500 Hz), pulse width (C: 0.05–0.60 msec) and amplitude (D: 30–90%) in dogs. Data are presented in mean and SE (*P < 0.05 vs baseline, n = 8).

