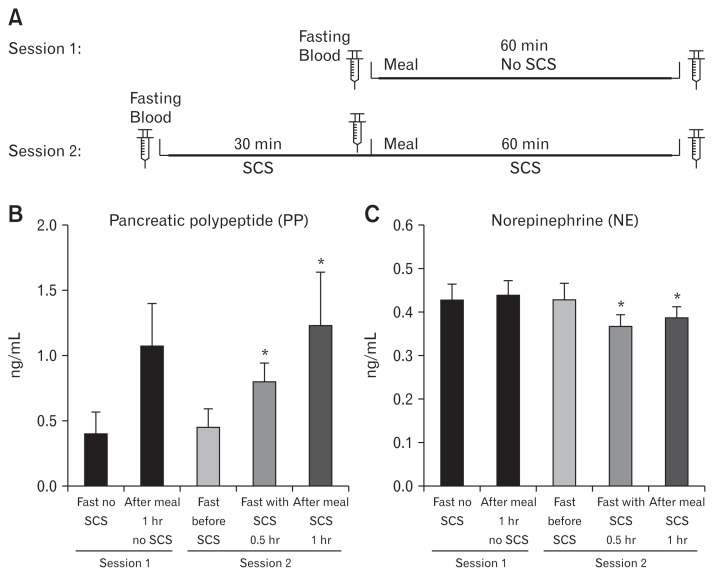
Figure 6.
Measuring the autonomic functions using parasympathetic (polypeptide [PP]) and sympathetic (norepinephrine [NE]) hormones in the bloodstream following SCS on T10 with our optimized parameters (pulse width: 0.5 msec, frequency: 20 Hz, and amplitude: 90.0% and 2 seconds on time/3 seconds off time). (A) Blood draw was performed in 2 distinct sessions as illustrated above. (B, C) shows the PP and NE release in separate sessions before and after SCS, respectively. Data presented in mean and SE (*P < 0.05 vs fasting state in SCS session, n = 8). Fast, fasting state.

