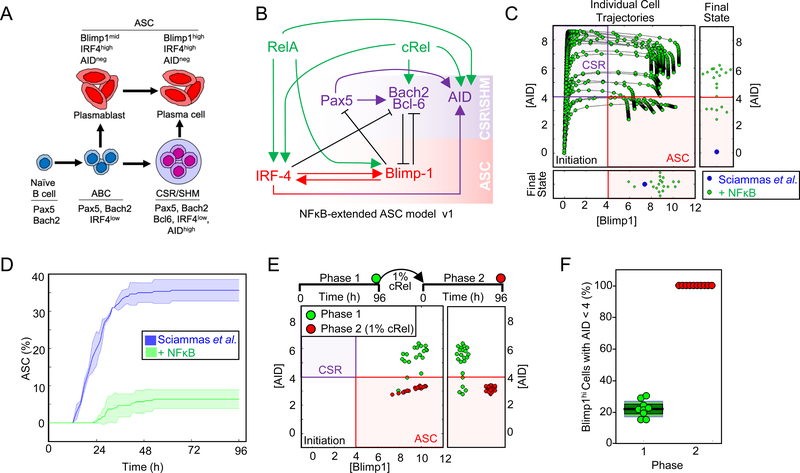
Figure 1: Mathematical modeling predicts that cRel prevents ASC differentiation.
A) Schematic of ASC generation. Stimulation of naïve B cells produces activated B cells (ABCs). ABCs either become plasma blasts or undergo class switch recombination (CSR) and somatic hypermutation (SHM) before differentiating into plasma cells. Here, plasma blasts and plasma cells are defined as antibody secreting cells (ASCs). The regulators and genetic signature that characterize each cell type are indicated. B) Schematic of NFκB-extended ASC differentiation model v1. This model was based on a previously published model from Sciammas et al. (Sciammas et al., 2011) to which RelA and cRel were added (see text). Rela- and cRel-mediated regulation is indicated in green, genes associated with the CSR/SHM state are shown in violet, and genes associated with the ASC state are shown in red. Arrows denote activation, and barred lines denote repression. C) The trajectories of Blimp1 and AID expression kinetics in the subset of cells that expressed high Blimp1 from a simulation of 125 cells. Four states are defined by two coordinate axes, namely Blimp1lowAIDlow (Initiation); Blimp1lowAIDhigh (CSR/ SHM); Blimp1highAIDhi; Blimp1highAIDlow (ASC). The final states are in the rectangular boxes below and on right indicating Blimp1 and AID expression respectively. Green points show the trajectories and final states of the NFκB-extended ASC differentiation model v1. Blue points indicate the final state obtained by all cells in simulations using a previously published model (Sciammas et al., 2011) D) Kinetics of ASC differentiation predicted by the Sciammas et al. ASC differentiation model and the NFκB-extended ASC differentiation model v1. The percentage of ASCs is plotted with time (h). The solid line indicates the mean and shaded region indicates the standard deviation of 3 simulations of 125 cells. E) The final states (96h) reached by cells expressing high Blimp1 in simulations of 125 starting cells with the NFκB-extended ASC differentiation model v1 (phase 1, green) and a subsequent simulation in which cRel activity in those cells was reduced to 1% and trajectories were simulated for 96h (phase 2, red). F) Bar graph of the fraction of ABCs becoming ASCs when cRel was allowed to remain at 100% of its expression (phase 1, green) or when it was forcibly reduced to 1% of its peak (phase 2, red). Median (black), standard deviation (dark green) and standard error mean (light green) are indicated.

