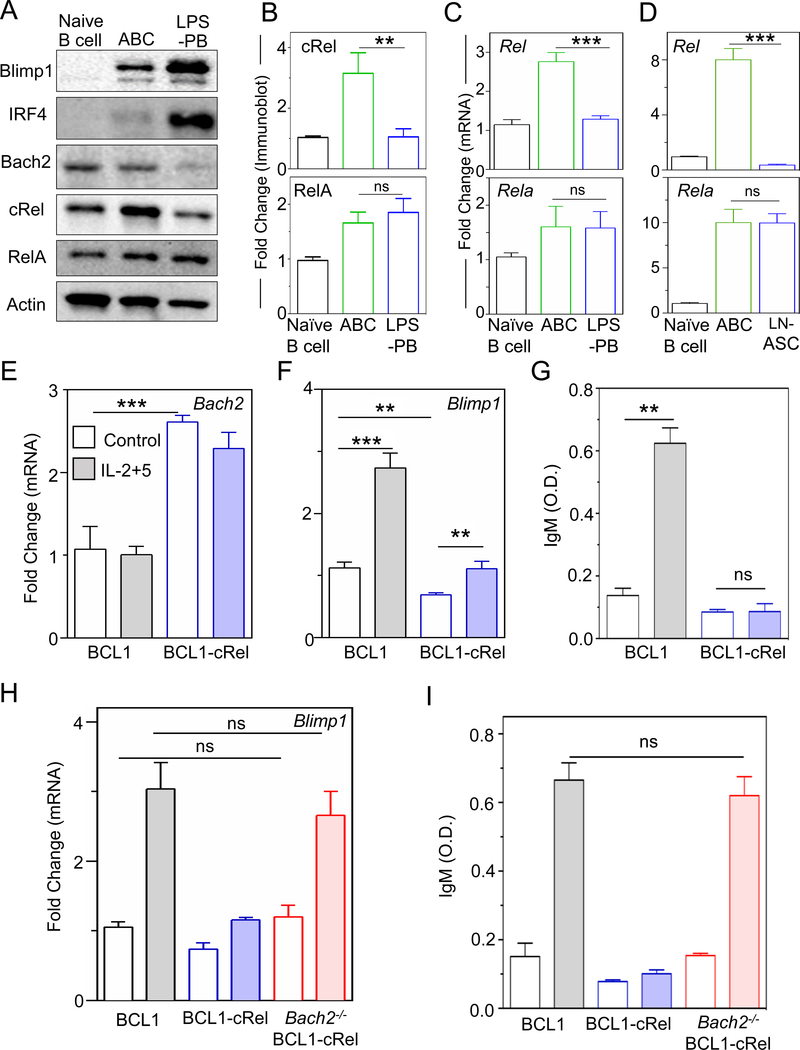
Figure 2: cRel repression is required for ASC differentiation.
A) Immunoblots of Blimp1, IRF4, Bach2, cRel (product of Rel gene), RelA and actin in naïve B cells, ABCs and LPS-PBs. ABCs and LPS-PBs were generated by stimulating naïve B cells with LPS for 72 h and then isolated by flow cytometry (described in Figure S2A). Data shown is representative of three biological replicates. B) Quantitative measurements of cRel and Rela immunoblots with actin as loading control. C) Quantitative measurements of mRNA expression by qPCR of Rel (encodes cRel protein) and Rela in naïve B cells, ABCs and LPS-PBs. D) Quantitative measurements of mRNA expression of Rel and Rela in naïve B cells, GC B cells and LN-ASC (Lymph node ASCs). Ubiquitin C was used as housekeeping gene to quantitate mRNA expression. E) and F) Quantitative measurements of mRNA expression of Bach2 and Blimp1 in unstimulated (Control, blank) and stimulated (IL-2+5 24 h, shaded) BCL1 (gray) and cRel-overexpressing BCL1 cells (blue, BCL1-cRel). IL-2 and IL-5 (shaded) stimulation is used throughout to differentiate BCL1 cells to ASC-like states. G) IgM production measured at 96 h by ELISA and expressed in optical density (O.D.) units. H) Quantitative measurement of mRNA expression of Blimp1 in unstimulated (control, blank) and stimulated (IL-2+5 24 h, shaded) BCL1 (gray), BCL1-cRel (blue), and Bach2-KO BCL1-cRel (red) cells. I) IgM production measured at 96 h by ELISA and expressed in optical density (O.D.) units. In all plots the mean and standard deviation of three replicates is indicated. *p < 0.05, **p< 0.01, ***p < 0.001 and not significant (ns) (Unpaired Students t-test).

