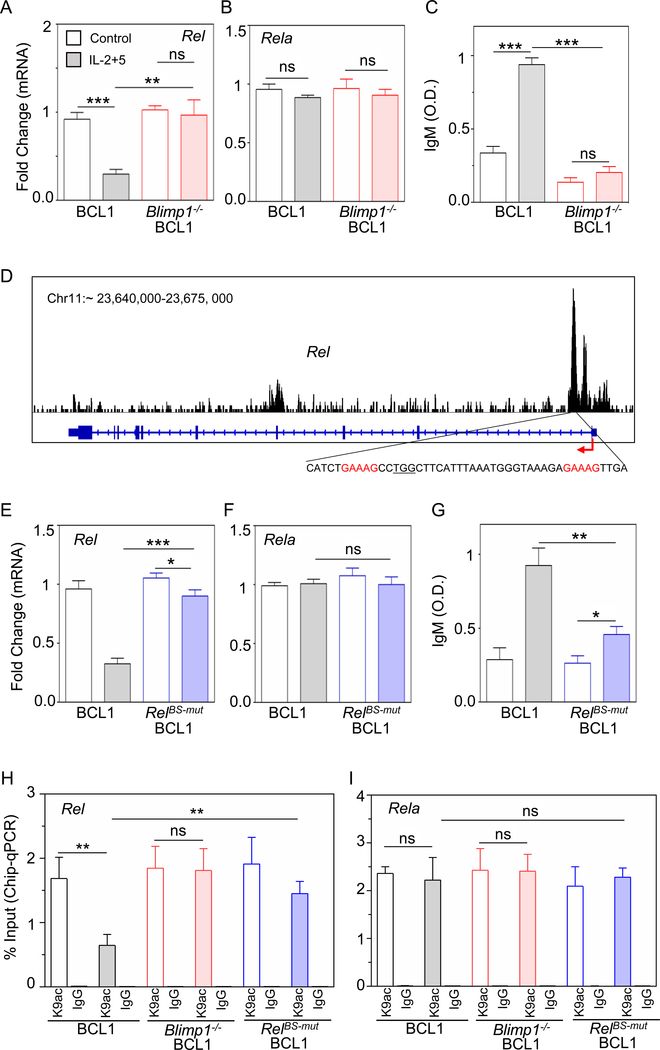
Figure 4: Blimp1 represses Rel expression and diminishes H3K9ac at the Rel locus.
A) and B) Quantitative mRNA expression by qPCR of Rel and Rela in unstimulated (control, blank) and stimulated (IL-2+5 24h, shaded) BCL1 (gray) and Blimp1−/− BCL1 (red) cells. C) IgM production measured at 96 h by ELISA and expressed in optical density (O.D.) units. D) Analysis of Blimp1 ChIP-seq data in plasmablasts (GSM1843340, Tellier et al., 2016). Blimp1 binding track (top); schematic of Rel locus (middle), consensus Blimp1 binding motif indicated in red and targeted PAM sequence is underlined (bottom). E) and F) Quantitative mRNA expression of Rel and Rela in unstimulated (control, blank) and stimulated (IL-2+5 24 h, shaded) BCL1 (gray) and RelBS-mut BCL1 cells (BCL1 cells mutated at the Blimp1 binding site in the Rel locus, blue). G) IgM production was measured at 96 h by ELISA and expressed in optical density (O.D.) units. H) and I) ChIP-qPCR yield for H3K9ac and IgG (isotype control) at the Rel locus (H) and Rela locus (I) in unstimulated (control, blank) and stimulated (IL-2+5 24h, shaded) BCL1 (gray), Blimp1−/− BCL1 (red) and RelBS-mut BCL1 cells (blue). The yield was calculated with respect to Input. The mean and standard deviation of three replicated is shown throughout. *p < 0.05, **p < 0.01, ***p < 0.001 and not significant (ns) (Unpaired Students t-test).

