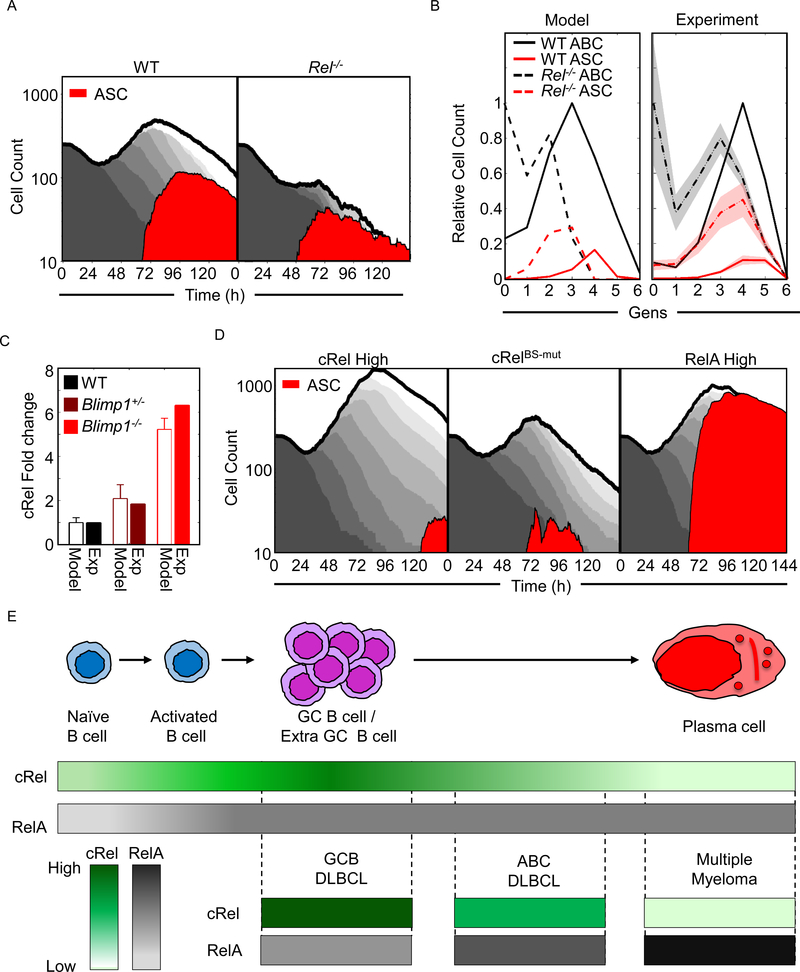
Figure 7: Co-ordinated cRel and RelA dynamics control the dynamics of B cell populations.
A) Area plots from multiscale modelling simulations of 125 WT and Rel−/− cells showing total cell number (grey), and ASC populations (Blimp1highAIDlow - red). Each subsequent generation of proliferating cells is indicated with a lighter grey. B) Line graphs showing generation-specific cell counts of ABCs (black) and ASCs (red) in WT (solid line) and Rel−/− (dashed line) simulations (left) and experiment (right, Figure 5G). Cell counts are normalized to the maximum cell count of ABCs for each genotype. The shaded region shows the standard deviation of three experimental replicates. C) Bar graph of the fold change of cRel expression over WT in wild-type (WT, black), Blimp1+/− (maroon) and Blimp1−/− (red) B-cells in simulations and experiment (details of experimental data shown in Figure S7). D) Area plots from multiscale modelling simulations of 125 cRel High (left), RelBs-mut (middle) and Rela high (right) cells showing total cell number (grey), and ASC populations (Blimp1highAIDlow - red). Each subsequent generation of proliferating cells is indicated with a lighter grey. E) Illustration of cRel and RelA dynamics during the physiological B cell response and their characteristic abundances in B cell malignancies. Upper panel: during B cell differentiation naïve B cell produces ABCs, followed by GC B cells/ Extra GC B cells before differentiating into PCs. Middle panel: color graph to represent expression of cRel (green) and RelA (gray) during the stages of B cell differentiation. Color gradient represents relative expression with darker colors indicating higher expression. Lower panel: cRel and RelA expression characteristic of indicated B cell malignancies. Their putative cell of origin is indicated by aligning with the upper panel.

