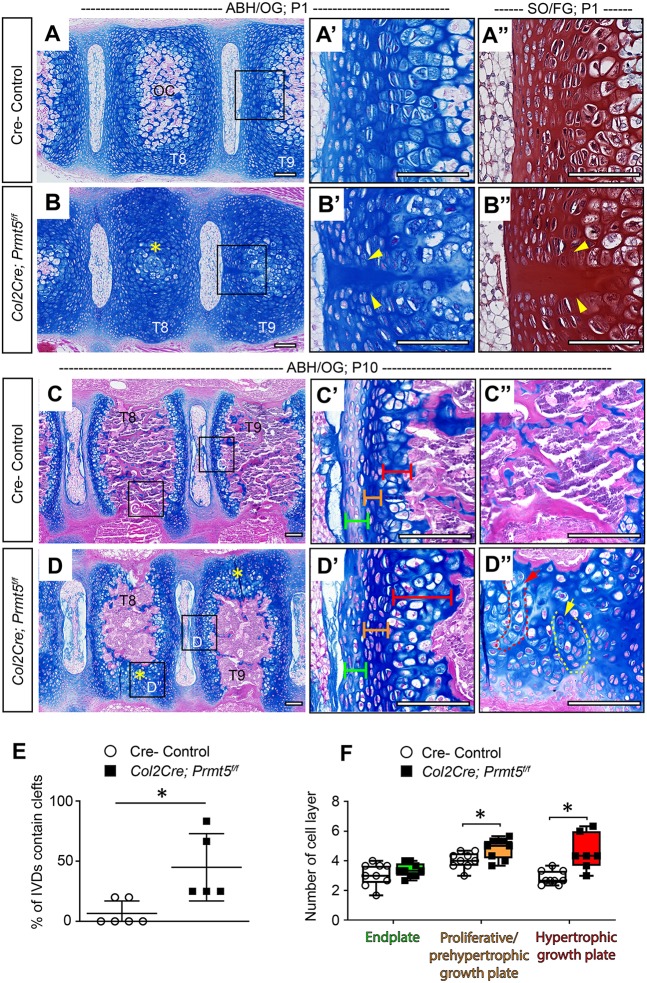
Fig. 2.
Loss of Prmt5 in osteochondral progenitor lineages of the spine results in defective ossification of the vertebral body. (A-D) Alcian Blue Hematoxylin/Orange G (ABH/OG) staining of thoracic spines of Cre– control (A,C) or Col2Cre;Prmt5f/f mutant (B,D) mice at P1 (A,B) and P10 (C,D). The boxes outline the areas shown at higher magnification in A′, A″, B′, B″, C′, C″, D′ and D″. (A″,B″) P1 adjacent sections stained with Safranin O/Fast Green (SO/FG). (B) Impaired ossification in Col2Cre;Prmt5f/f mutant vertebrae (yellow asterisk). (B′,B″) Representative images of midline clefts consistently observed in mutant endplate, but less common in Cre– control mice (A′,A″) (yellow arrowheads; n=6 for controls and n=5 for mutants). (D) At P10, regions of asymmetric defects of bone formation observed in the vertebrae of Col2Cre;Prmt5f/f mutant mice (D, yellow asterisks), which are ossified in Cre– control mice (C). The organization of chondrocytes in regions of persistent cartilage were found in columns (D″, red arrow/dashed outline) and clusters (D″, yellow arrow/dashed outline) (n=3 for each group). Endplate, proliferative/prehypertrophic growth plate and hypertrophic growth plate are labeled with green, orange and red brackets, respectively. The regions of the thoracic spine checked (T8, T9) are labeled on the vertebrae. (E) Quantification of the percentile of IVDs contain midline clefts in control and mutant IVD at P1 as shown in B-B″. Each dot represents one mouse analyzed, plotting with mean±s.d. (n=6 mice for controls and n=5 mice for mutants). Four to six thoracic IVDs were checked for each mouse. (F) Quantification of the number of cell layers of the endplate and growth plate in control and mutant mice at P10 as shown in C′ and D′. Each dot in the box and whisker plot represents the counts from a single IVD and adjacent growth plate analyzed. Each IVD and growth plate was analyzed three times and averaged, and at least two IVDs and growth plates were analyzed per mouse (n=3 mice for each group). *P<0.05, two-tailed Student's t-test. Scale bars: 100 µm.

