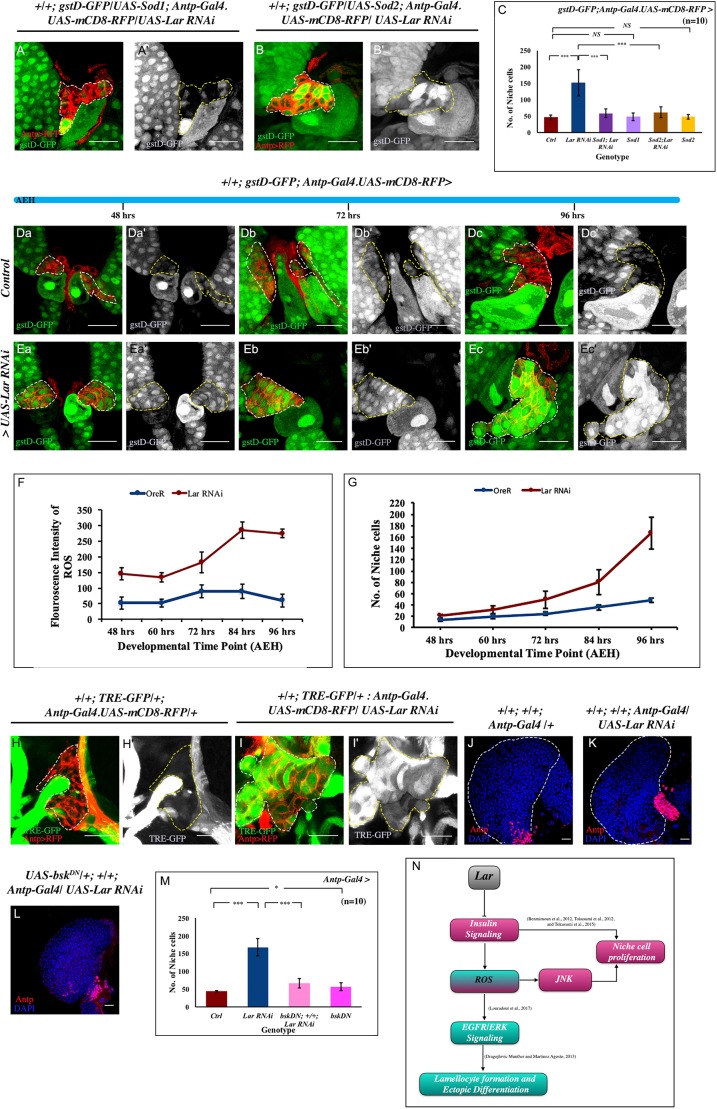
Fig. 5.
Gradual increase in ROS over time is associated with increased niche cell proliferation. (A-B′) Scavenging ROS by overexpressing both Sod1 and Sod2 in conjunction with loss of Lar from the niche resulted in rescue in both ROS (gstD-GFP, green) and a partial rescue in niche cell number (Antp-Gal4.UAS-RFP, red). (C) Quantification of niche cell number in A-B′ (n=10; P=1.321×10⁻⁵ for WT versus Lar RNAi, P=2.493×10⁻⁵ for Lar RNAi versus UAS Sod1; Lar RNAi, P=0.708 for WT versus UAS Sod1, P=2.952×10⁻⁵ for Lar RNAi versus UAS Sod2; Lar RNAi, P=0.551 for WT versus UAS Sod2; two-tailed unpaired Student's t-test). (Da- Ec′) Temporal analysis for ROS was carried out both in control and in Lar loss from the niche. In the developmental timeline from 48 h to 96 h AEH, a basal level of ROS was detected in the wild-type (WT) niche (Da-Dc′). A gradual accumulation of ROS, which maximized after 72 h AEH, was seen upon Lar abrogation from the niche (Ea-Ec′). (F,G) Graphical representation of ROS (F) and niche cell number (G) in control and experiment. (H-I′) Upregulation of JNK signaling visualized by its reporter TRE-GFP in Lar knockdown (I,I′) compared with WT niche (H,H′). (J-L) Increased niche number (Antp, red) observed on Lar loss from the niche (K), compared with control (J), is partially rescued by downregulating JNK (bskDN) in conjunction with Lar downregulation (L). (M) Quantification of J-L and Fig. S5F (n=10; P=9.474×10⁻⁶ for WT versus Lar RNAi, P=3.249×10⁻⁶ for Lar RNAi versus bskDN; +; Lar RNAi, P=0.019 for WT versus bskDN; two-tailed unpaired Student's t-test). (N) Lar regulates insulin signaling, thereby controlling niche cell number. The absence of Lar function leads to increased insulin signaling, resulting in upregulated ROS that contributes to cell proliferation by JNK activation. White dashed lines in A,B,Da,Db,Dc,Ea,Eb,Ec,H,I and yellow dashed lines in A′,B′,Da′,Db′,Dc′,Ea′,Eb′,Ec′,H′,I′ outline the niche. White dashed lines in J,K mark the boundary of the lymph gland. The genotype of the larvae is described in the panels. Data are mean±s.d. *P<0.05, ***P<0.0005. NS, not significant. Scale bars: 20 µm.

