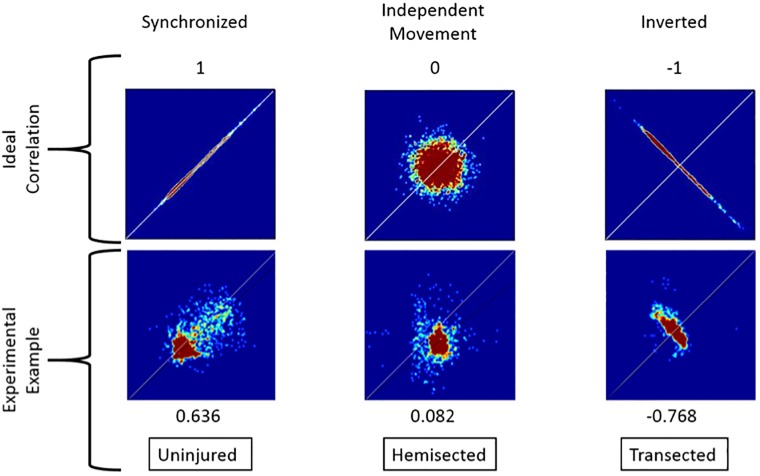
Fig. 1.
Synchronization variance in 2D heatmaps and the expected output of each behavior. An example is given of each type of froglet compared to the ideal correlation of each of the three types of synchronization, previously defined as: synchronized, independent and inverted. Rows show: type of movement, ideal correlation, ideal distribution, one experimental example, measured correlation and original class, respectively.

