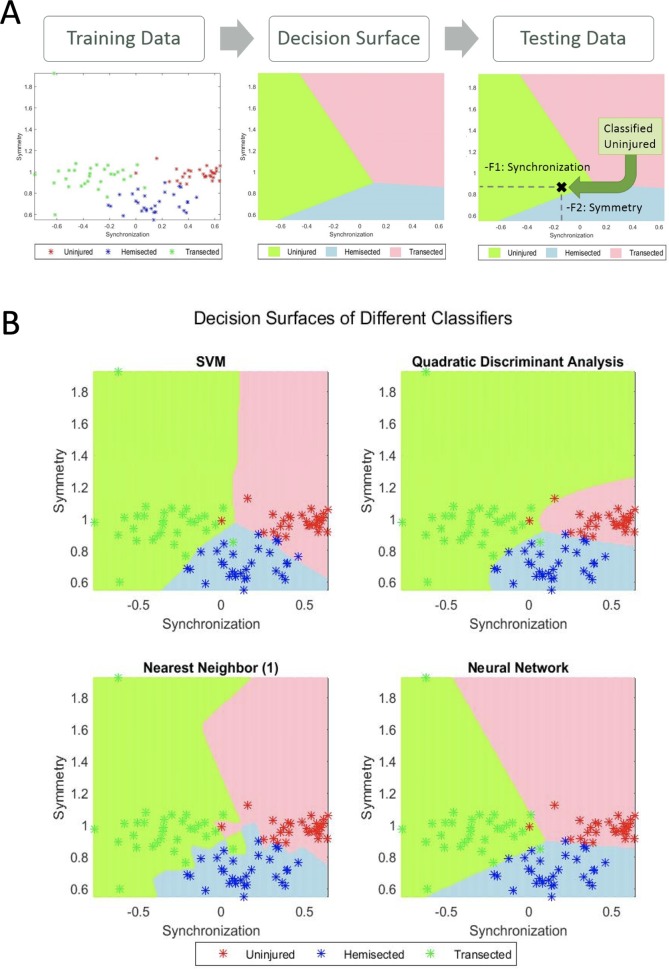
Fig. 9.
Examples of the output of a classifier plotting all 90 videos using two features: synchronization (F1) and symmetry (F2). (A) Diagram of a classification process. Labeled training data is computed to a decision surface of the feature space. This is a mathematical formula that depends on the type of classifier. New data can be tested and classified depending where it falls in the decision surface. (B) Different classifiers and how they divide the feature space in decision boundaries.

