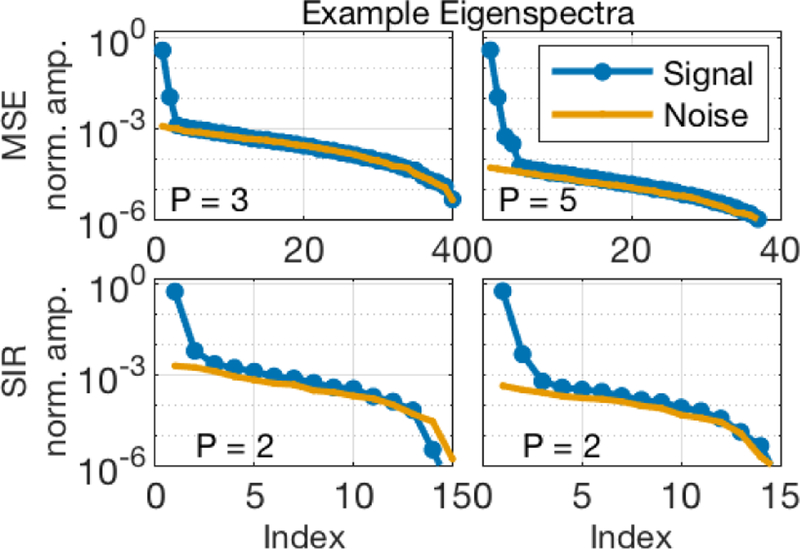
FIGURE 10.
Eigenvalues from the PCA analysis of example Nv voxel regions overlapping the corpus callosum in mouse brain. The top row shows result from MSE images (Nv = 49), acquired with NA = 12 (left) and 256 (right). The bottom shows results from IR images (Nv = 16), acquired with NA = 3 (left) and 64 (right). In each frame, the number of principal components retained from the MP-PCA algorithm, P, is identified.

