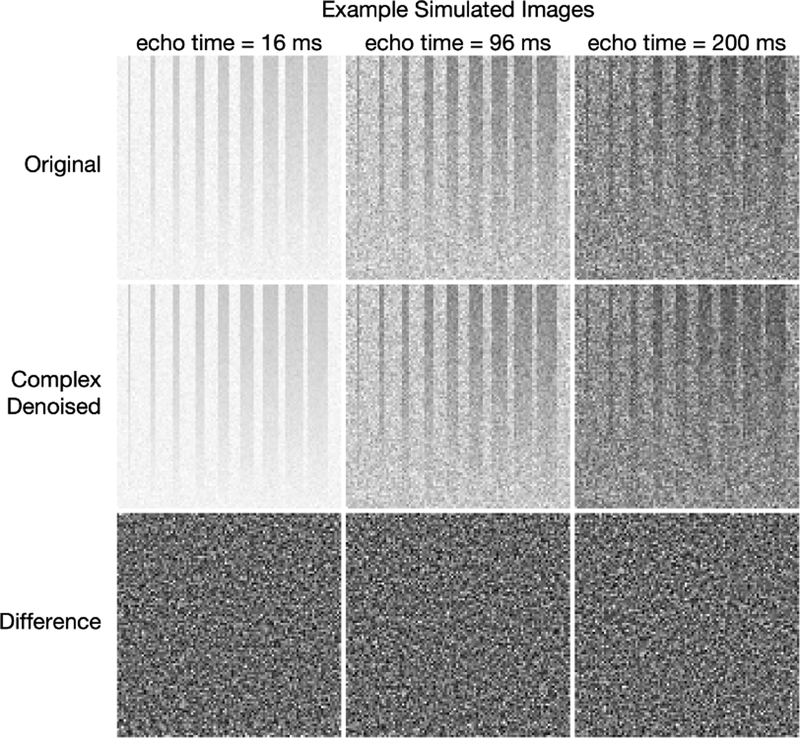
FIGURE 2.
Example simulated images from the scenario with NE = 40, TE = 8ms, σT2l = 5 ms, and SNR = 200. The top row shows original noisy images. The second and third rows show the complex denoised images and the difference images, respectively. At each different echo time, the original and denoised images are all displayed using the same grayscale, and all three differences images are scaled to ±3σ.

