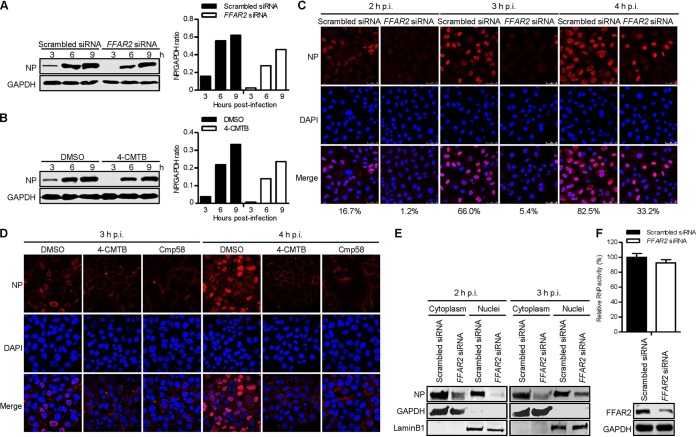
FIG 5.
FFAR2 affects the early stage of the IAV replication cycle. (A) FFAR2 siRNA- or scrambled siRNA-treated A549 cells were infected with AH05 (H5N1) virus (MOI = 5). Whole-cell lysates were collected at the indicated time points and subjected to Western blotting with a rabbit anti-NP pAb. (B) A549 cells were pretreated with 100 μM 4-CMTB or DMSO for 3 h and then infected with AH05 (H5N1) virus (MOI = 5). Whole-cell lysates were collected at the indicated time points and subjected to Western blotting with a rabbit anti-NP pAb. (C) A549 cells were treated with FFAR2 siRNA or scrambled siRNA for 48 h and then infected with AH05 (H5N1) virus (MOI = 5). At 2, 3, and 4 h p.i., the infected cells were fixed and stained with a rabbit anti-NP pAb, followed by incubation with Alexa Fluor 633 goat anti-rabbit IgG(H+L) (red). The nuclei were stained with DAPI (blue). The ratio of virus-infected cells showing nuclear localization of viral NP was calculated from more than 150 cells and is indicated at the bottom of each panel of three images. (D) A549 cells were pretreated with 100 μM 4-CMTB, 10 μM Cmp58, or DMSO for 3 h and then infected with AH05 (H5N1) virus (MOI = 5). At 3 and 4 h p.i., the infected cells were fixed and stained as described above for panel C. (E) FFAR2 siRNA- or scrambled siRNA-transfected A549 cells were infected with AH05 (H5N1) virus (MOI = 5). At 2 and 3 h p.i., the cells were separated into nuclear and cytoplasmic fractions. Each fraction was subjected to Western blotting with a rabbit anti-NP pAb, a rabbit anti-GAPDH pAb, and a rabbit anti-LaminB1 pAb. (F) HEK293T cells treated with FFAR2 siRNA or scrambled siRNA for 24 h were transfected with the four viral RNP protein expression plasmids (PB2, PB1, PA, and NP), together with pHH21-SC09NS F-Luc and pRL-TK. Thirty-six hours later, the knockdown of FFAR2 was confirmed by Western blotting, and a dual-luciferase assay was performed in which the firefly luciferase activity was normalized to the activity of the internal control, Renilla luciferase. The band intensities of the Western blots were quantified by using ImageJ software and are expressed as relative NP/GAPDH ratios (A and B).

