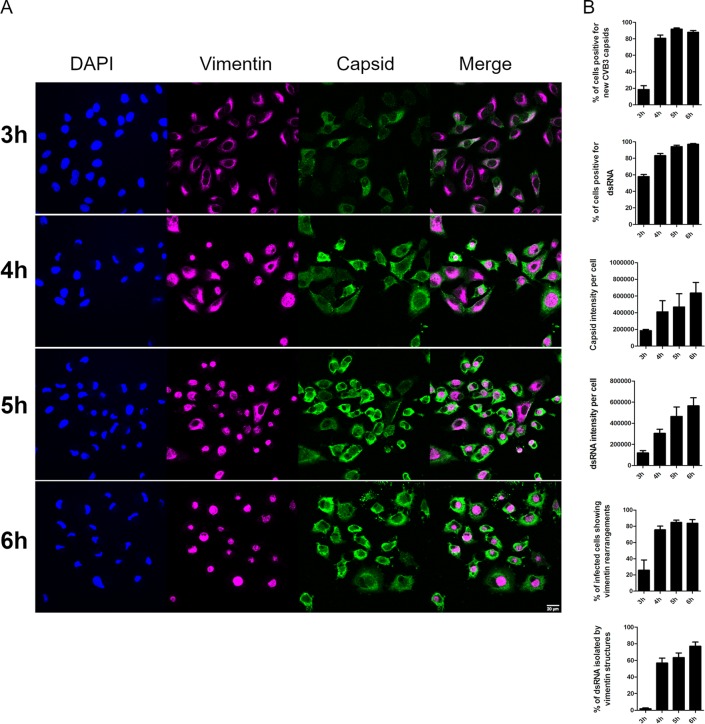
FIG 2.
Appearances of VP1 and dsRNA coincide with vimentin rearrangements during CVB3 infection. A549 cells were fixed, immunolabeled, and visualized with confocal microscopy. (A) Single-section images showing vimentin and VP1 (capsid) at different time points p.i. (B) Quantifications of confocal images taken at different time points during CVB3 infection. The results shown here are representations of at least three independent experiments. For the quantifications, approximately 200 cells altogether from two to three replicates were analyzed (±SEM). Scale bars, 20 μm.

