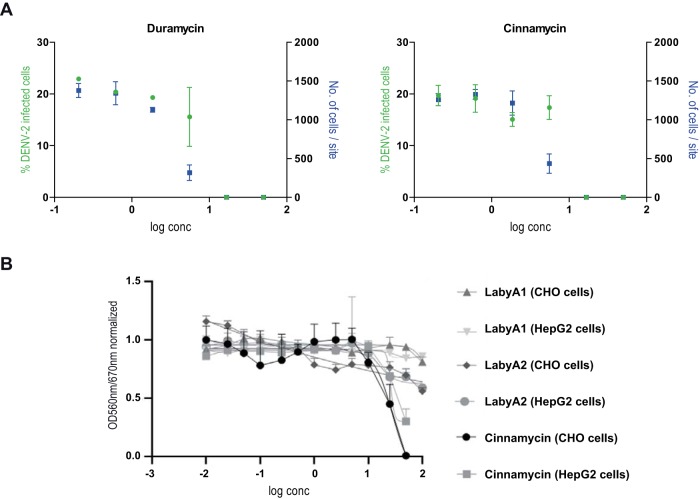
FIG 5.
(A) Duramycin-biotin and cinnamycin exert cytotoxic effects. Dose-response curves were obtained by high-content imaging. A decrease in cell number/site (blue symbols) at higher compound concentrations indicates cytotoxicity. This effect presumably masks any antiviral activity. Values shown are means of 2 assays ± SEM. (B) CHO and Hep G2 cell toxicity of cinnamycin, LabyA1, and LabyA2 investigated by an MTT assay. Values shown are means of 3 assays ± SEM. CC50 values for cinnamycin were 28.4 and 26.1 μg/ml on CHO and Hep G2 cells, respectively. CC50 values for LabyA1 were >100 μg/ml on both CHO and Hep G2 cells. CC50 values for LabyA2 were around 100 μg/ml on both CHO and Hep G2 cells.

