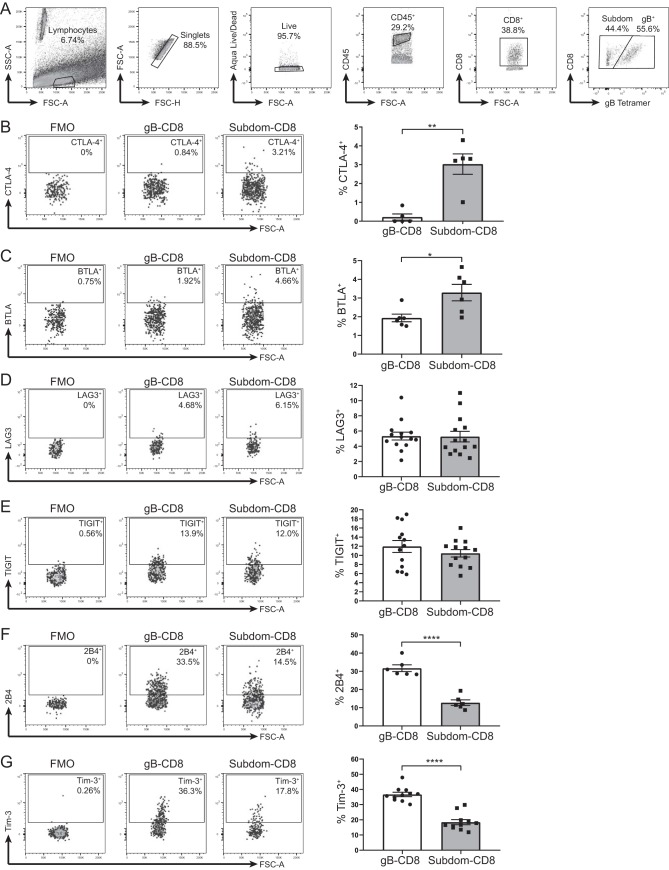
FIG 1.
Tim-3 and 2B4 are preferentially expressed on gB-CD8+ T cells during latent HSV-1 infection. TGs from latently infected mice (33 to 43 dpi) were removed; processed into single-cell suspensions; stained for viability, CD45, CD8, CTLA-4, BTLA, LAG3, TIGIT, 2B4, or Tim-3 and the gB tetramer to distinguish gB-CD8+ T cells from Subdom-CD8+ T cells; and analyzed by flow cytometry. Representative dot plots from one mouse showing the expression of the indicated checkpoint molecules on the gB-CD8+ T cells and Subdom-CD8+ T cells are shown along with the FMO gating control, with a graph from one representative experiment shown on the right (B to G). In the graphs, bars represent means ± standard error of the mean (SEM). Differences between groups were assessed by unpaired t tests (*, P ≤ 0.05; **, P ≤ 0.01; ****, P ≤ 0.0001). (A) Gating strategy is as follows: lymphocytes were first gated by size, doublets were excluded, dead cells were excluded, CD45+ cells were gated, CD8+ cells were gated, and CD8+ cells were split into gB-CD8+ T cell or Subdom-CD8+ T cell groups by using the gB tetramer before looking at the various checkpoint molecules. FSC, forward scatter; SSC, side scatter. (B) Expression of CTLA-4 (stained both extracellularly and intracellularly) (n = 5). Data are representative of results from two independent experiments. (C) Expression of BTLA (n = 6). Data are representative of results from two independent experiments. (D) Expression of LAG3 (n = 14). Data are representative of results from of two independent experiments. (E) Expression of TIGIT (n = 13). Data are representative of results from two independent experiments. (F) Expression of 2B4 (n = 6). Data are representative of results from four independent experiments. (G) Expression of Tim-3 (n = 11). Data are representative of results from 10 independent experiments.

