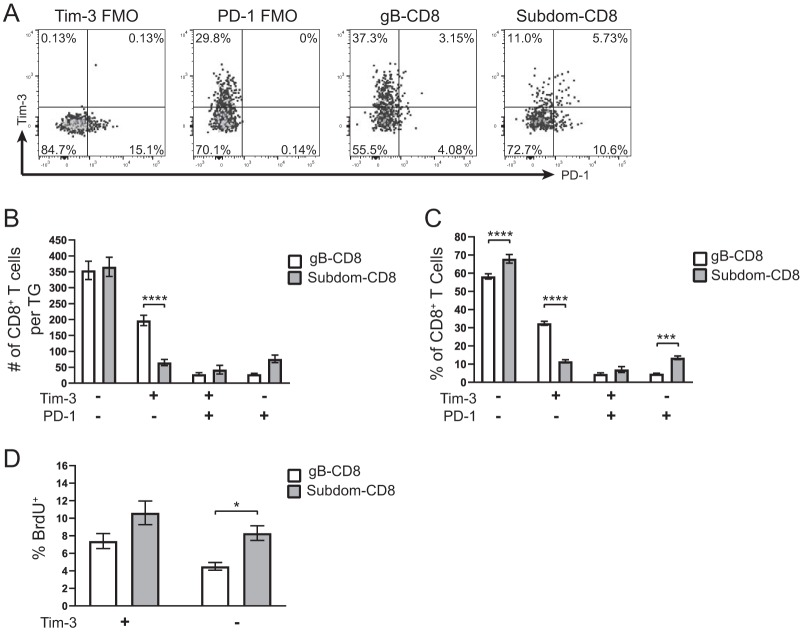
FIG 2.
Tim-3 is primarily expressed on PD-1− CD8+ T cells in the latently infected TG. TGs from latently infected mice (33 to 35 dpi) were removed; processed into single-cell suspensions; stained for viability, CD45, CD8, gB tetramer, Tim-3, and PD-1; and analyzed by flow cytometry. To assess in vivo T cell proliferation, mice received i.p. injections of 1 mg of BrdU 48 and 24 h prior to sacrifice, and BrdU uptake was measured by flow cytometry. Representative dot plots from one mouse showing the expression of the indicated checkpoint molecules on gB-CD8+ T cells and Subdom-CD8+ T cells are shown along with the FMO gating controls (A). In the graphs, the bars represent the mean number of cells, percentage of CD8+ T cells, or percentage of BrdU+ cells ± SEM. Differences in panels B to D were assessed by two-way analysis of variance (ANOVA) with Tukey’s posttests (*, P ≤ 0.05; ***, P ≤ 0.001; ****, P ≤ 0.0001). (A) Expression of Tim-3 and PD-1. (B) Total number of CD8+ T cells/TG in each of the Tim-3/PD-1 quadrants from panel A (n = 11). The experiment was repeated an additional eight times, with similar results. (C) Percentage of CD8+ T cells in each of the Tim-3/PD-1 quadrants from panel A (n = 11). The experiment was repeated an additional eight times, with similar results. (D) gB-CD8+ T cell and Subdom-CD8+ T cell populations were each gated into Tim-3+ and Tim-3− populations, and the percentages of cells that were BrdU+ in each subgroup are shown (n = 25). Data are from two pooled independent experiments.

