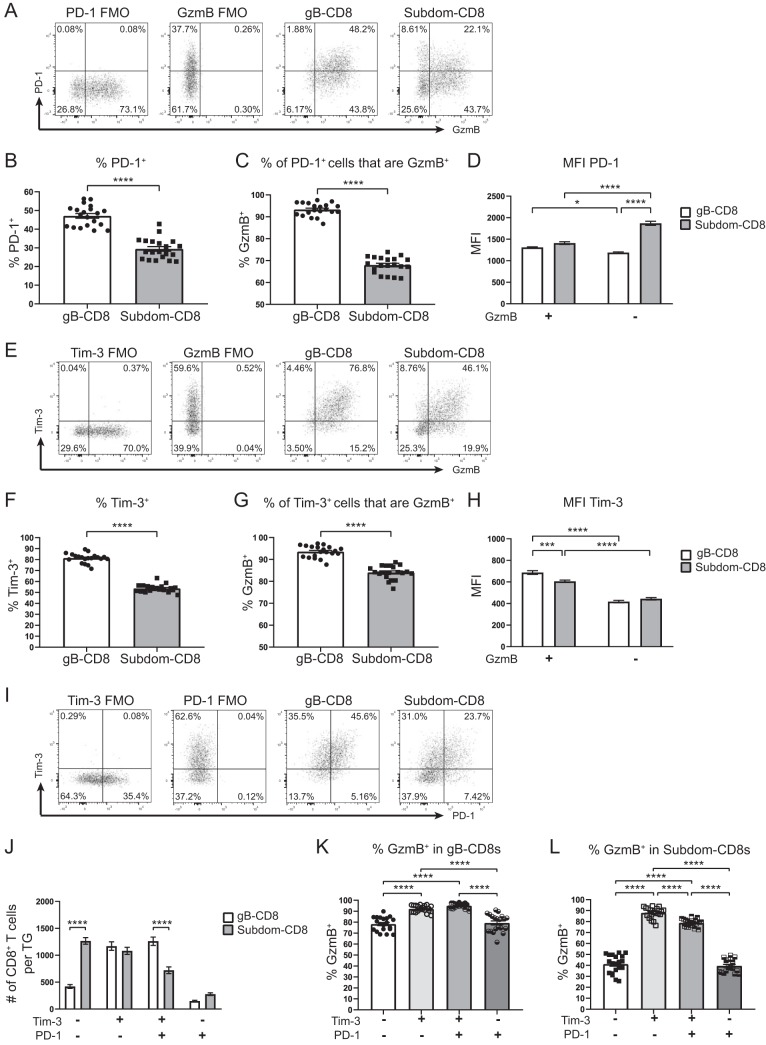
FIG 7.
Tim-3+ cells are functional at early times postinfection. TGs from acutely infected mice (8 dpi) were removed; processed into single-cell suspensions; stained for viability, CD45, CD8, gB tetramer, Tim-3, PD-1, and GzmB; and assessed by flow cytometry. In graphs, bars represent means ± SEM (n = 20). Data were pooled from two independent experiments. Data in panels D, H, and J were analyzed by two-way ANOVAs with Tukey’s posttests; data in panels K and L were analyzed by one-way ANOVAs with Tukey’s posttests; and data in panels B, C, F, and G were analyzed by unpaired t tests (*, P ≤ 0.05; ***, P ≤ 0.001; ****, P ≤ 0.0001). (A) Representative dot plots from one mouse showing the expression of PD-1 and GzmB on gB-CD8+ T cells and Subdom-CD8+ T cells along with the FMO gating controls. (B) Percentages of cells in gB-CD8+ T cell and Subdom-CD8+ T cell groups that are PD-1+. (C) Percentages of PD-1+ cells in gB-CD8+ T cell and Subdom-CD8+ T cell groups that are GzmB+. (D) Mean fluorescence intensities (MFI) of PD-1 in PD-1+ GzmB+ and PD-1+ GzmB− gB-CD8+ T cell and Subdom-CD8+ T cell groups. (E) Representative dot plots from one mouse showing the expression of Tim-3 and GzmB on gB-CD8+ T cells and Subdom-CD8+ T cells along with the FMO gating controls. (F) Percentages of cells in gB-CD8+ T cell and Subdom-CD8+ T cell groups that are Tim-3+. (G) Percentages of Tim-3+ cells in gB-CD8+ T cell and Subdom-CD8+ T cell groups that are GzmB+. (H) MFI of Tim-3 in Tim-3+ GzmB+ and Tim-3+ GzmB− gB-CD8+ T cell and Subdom-CD8+ T cell groups. (I) Representative dot plots from one mouse showing the expression of Tim-3 and PD-1 on gB-CD8+ T cells and Subdom-CD8+ T cells along with the FMO gating controls. (J) Total numbers of CD8+ T cells/TG in each of the Tim-3/PD-1 quadrants from panel I. (K) Percentages of gB-CD8+ T cells in Tim-3/PD-1 quadrants that are GzmB+. (L) Percentages of Subdom-CD8+ T cells in Tim-3/PD-1 quadrants that are GzmB+.

