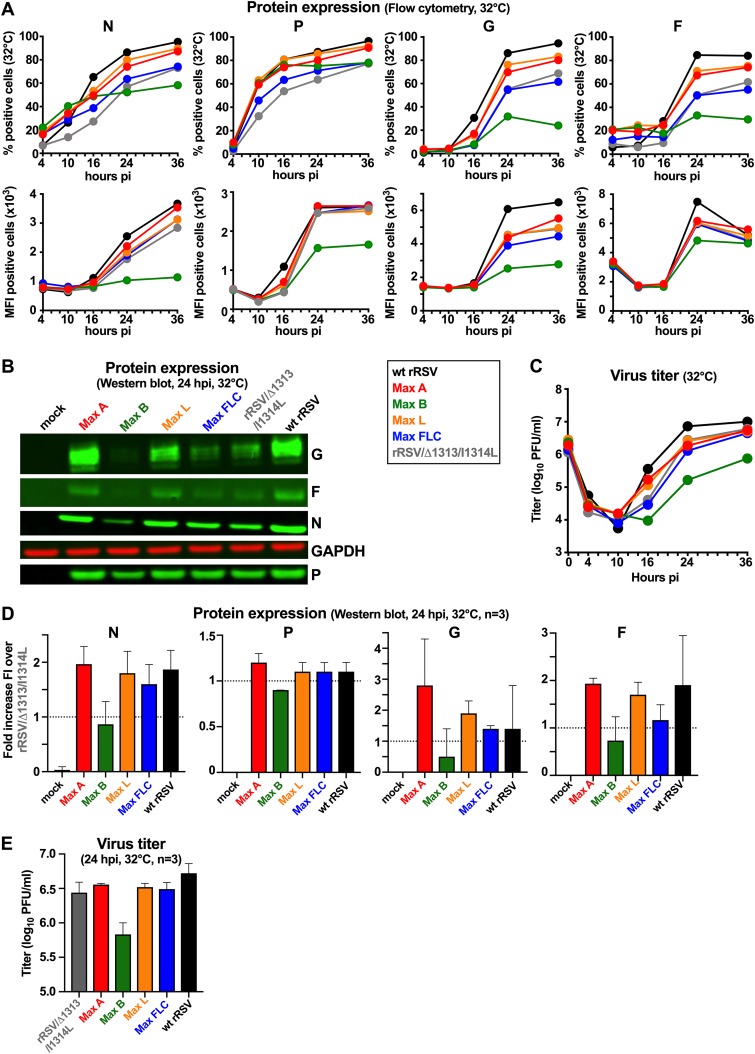
FIG 5.
Effects of CPO on the production of RSV proteins and virions during single-cycle replication of wt rRSV, rRSV/Δ1313/I1314L, and CPO rRSVs. (A to C) Additional replicate wells of Vero cell monolayers were infected in parallel with those for Fig. 3, incubated at 32°C or 37°C, and harvested for analysis by flow cytometry (A), Western blotting (B), and titration (C) to measure virus production. (A) Flow cytometry. One well per virus/time point, from cells incubated at 32°C, was harvested at 4, 10, 16, 24, and 36 hpi and analyzed by flow cytometry to determine the percentage of cells that expressed detectable N, P, G, and F proteins as well as the median fluorescence intensity (MFI) of the positive cells. (B) Western blot analysis. One well per virus, incubated at 32°C, was harvested at 24 hpi and analyzed by Western blotting. The G, F, N, and P proteins are shown, with GAPDH as a loading control. (C) Virus production. One well per virus/time point was harvested at 0, 4, 10, 16, 24, and 36 hpi and processed for virus titration as described for Fig. 2. (D and E) Two additional single-cycle replication experiments involving Western blot analysis and virus production were performed using the same conditions as for panels B and C, respectively, to provide confirmatory data. (D) Western blotting. For each of two additional experiments, one well per virus, incubated at 32°C, was harvested at 24 hpi and analyzed by Western blotting as for panel B. The data from these two experiments were combined with those from panel B and are expressed as fold increase in fluorescence intensity (FI) over that of rRSV/Δ1313/I1314L at the same time point, with the range shown. (E) Virus production. For each of two additional experiments, one well per virus/time point, from cells incubated at 32°C, was harvested at 24 hpi and processed for virus titration as described for panel C. The data from these two experiments were combined with those from panel C and are expressed as median values with the range shown.

