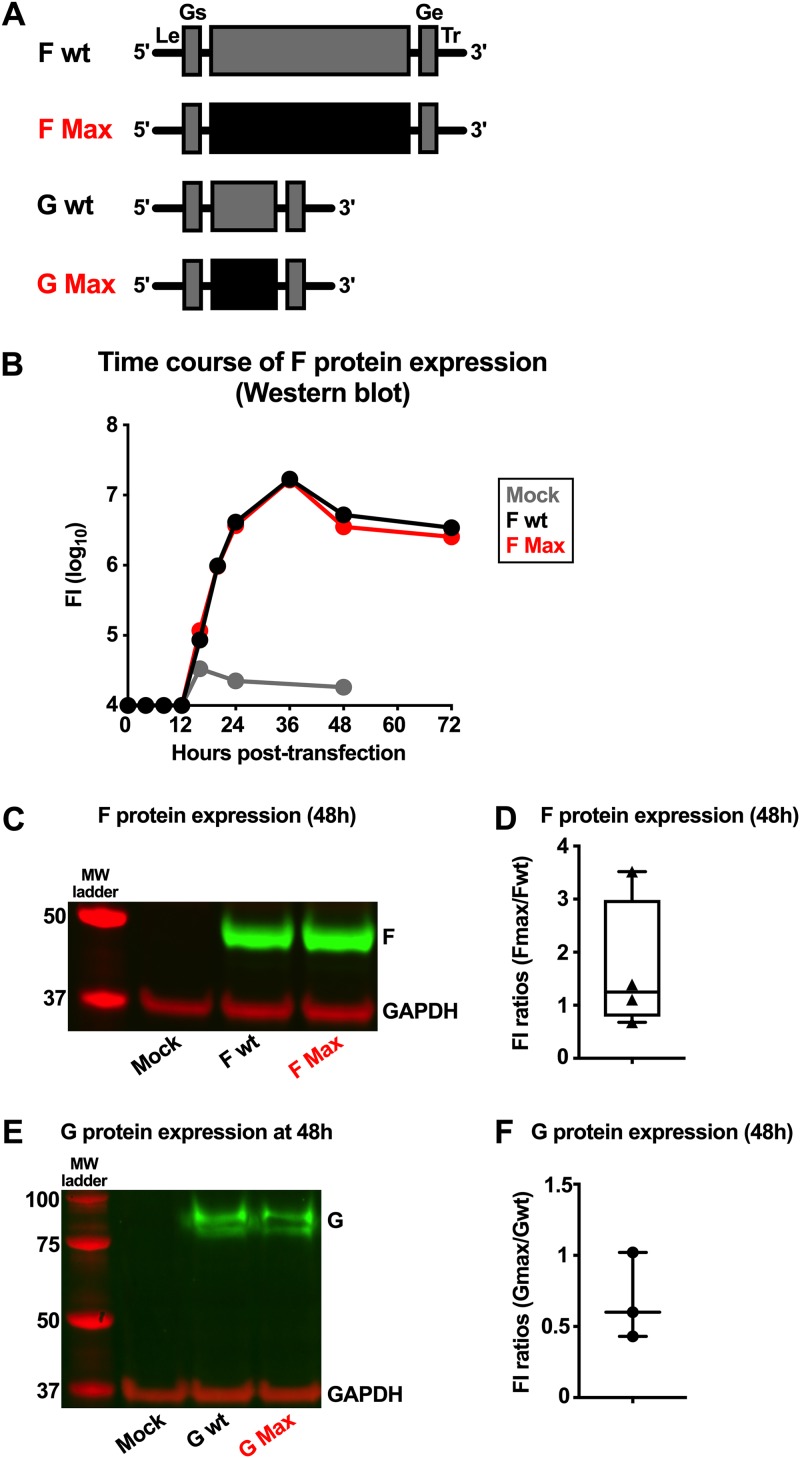
FIG 6.
Expression of G and F proteins from wt and CPO ORFs contained in minigenomes. Four RSV minigenomes were constructed that each contained a single gene with a wt or CPO ORF encoding RSV G or F. (A) Gene maps of the four cDNAs used to evaluate the expression of F and G. Each cDNA contained a single G or F ORF, either wt or CPO, under the control of wt G or wt F gene start (Gs) and gene end (Ge) transcription signals, with an upstream RSV leader region (Le) and downstream trailer region (Tr). Each cDNA was cloned into a pBluescript plasmid vector, with the Le region preceded by a T7 promoter and the Tr region followed by a self-cleaving ribozyme (not shown), such that expression by the T7 RNA polymerase yielded a positive-sense RNA copy with correct 3′ and 5′ ends. (B to F) The ability of the CPO versus wt F and G ORFs to express F and G was tested on BSR T7/5 cells that constitutively express the T7 RNA polymerase. BSR T7/5 cells were transfected with a plasmid mixture encoding the indicated minigenome, together with the four RSV support plasmids expressing the N, P, M2-1, and L proteins, which are necessary to reconstitute the virus polymerase complex that directs viral transcription and RNA replication. Mock-transfected cells were used as controls. Cells were incubated at 32°C and harvested at the indicated times for analysis by Western blotting. (B) Kinetics of F protein expression, evaluated by Western blotting and expressed as fluorescence intensity (FI). (C and D) Western blots to evaluate F protein expression at 48 h posttransfection, with GAPDH as a loading control and a protein ladder as markers for protein size. (C) Results from a representative experiment. (D) The FI of F protein from CPO versus wt ORFs from 4 independent Western blot experiments using dye-labeled antibodies was measured as described in Materials and Methods. Data are represented as F Max/F wt ratios. The box plots show the median (horizontal line) flanked by the second and third quartiles. The outer bars show the range of values. (E and F) Western blots to evaluate G protein expression. (E) Results from a representative experiment. (F) FI ratios of G protein from CPO versus wt ORFs from 3 independent experiments. The median (horizontal line) and the range of values are shown.

