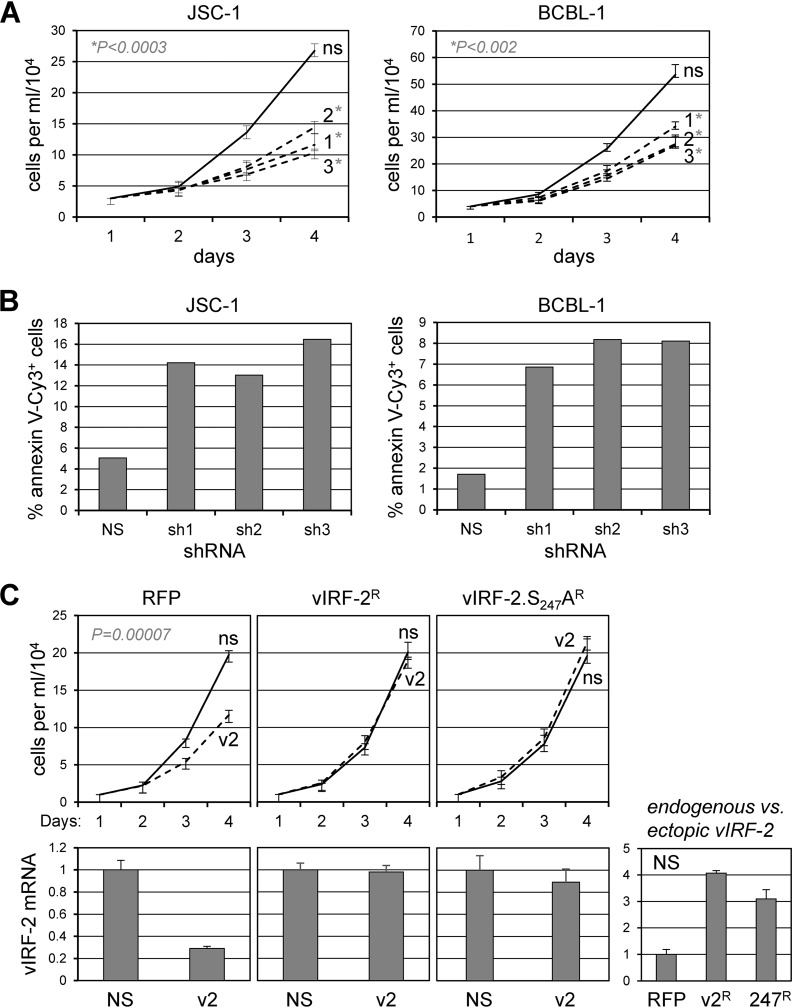
FIG 8.
Contributions of vIRF-2 and vIRF-2-USP7 interaction to latently infected PEL cell growth and viability. (A) Growth curves (viable cell density/time) for JSC-1 and BCBL-1 (TRExBCBL1-RTA) cells transduced with lentiviral vectors expressing vIRF-2 mRNA-targeting shRNAs (1 to 3) or nonsilencing shRNA control (ns). Data were derived from triplicate cultures for each condition; error bars show standard deviations from the means. Statistical significance between values for each vIRF-2 shRNA and control shRNA samples was determined by Student's t test (two tailed); P values for vIRF-2 shRNA 1-, 2-, and 3-reduced cell densities (relative to NS shRNA-transduced controls) at day 4 were 0.00021, 0.00013, and 0.00002 for JSC-1 cultures and 0.00127, 0.00065, and 0.00108 for BCBL-1 cultures. (B) Measurements of apoptosis by Cy3-annexin V staining of day 4 cultures (pooled for each shRNA) shown in panel A. Cells were counterstained with Hoechst dye to identify nuclei, and the percentages of Cy3-annexin V+ cells were calculated from data derived from multiple random fields per sample (>900 total cells/sample). (C) vIRF-2 mRNA-specific shRNA3 (v2) or control (ns) shRNA was expressed via lentiviral vector transduction in BCBL-1 (TRExBCBL1-RTA) cells pretransduced with lentiviruses expressing shRNA3-resistant mRNAs encoding vIRF-2 (vIRF-2R) or vIRF-2.S247A (vIRF-2.S247AR) or with RFP-expressing lentiviral vector (RFP, control). Cell growth was monitored as outlined for panel A. Charts below the growth curves show the relative levels of vIRF-2 transcripts in the respective PEL cultures, as determined by RT-qPCR applied to RNA extracted from terminal (day 4) cultures; the rightmost chart shows the levels of vIRF-2 mRNA in vIRF-2 and vIRF-2.S247A vector-transduced cells (absent depletion) relative to the level in the RFP-expressing control vector-transduced cells. For all charts, average values from triplicate samples are shown, with error bars indicating standard deviations of the individual from the average values. The P value for the growth effect of uncomplemented (RFP) vIRF-2 depletion was obtained by Student's t test (two tailed).

