Fig. 1.
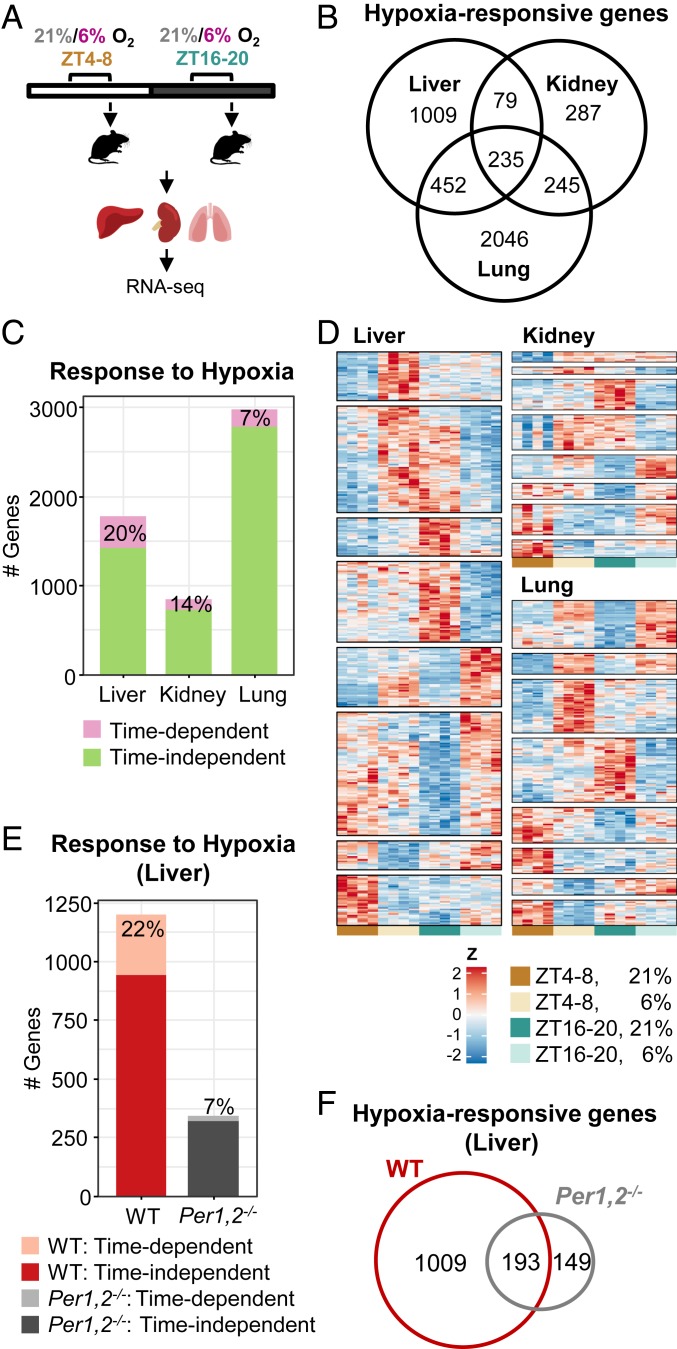
The transcriptional response to hypoxia is time- and tissue-dependent. (A) Schematic representation; mice were exposed to 4 h of either hypoxia (6% O2) or normoxia (21% O2) in the light (ZT 4–8) or dark (ZT 16–20) phase. Animals were killed, tissues were harvested, and RNA was prepared and sequenced. (B) Venn diagram representing the number of genes that significantly responded to hypoxia in each tissue, including response at either of the time points or a significant interaction (stage-wise analysis, Overall False Discovery Rate [OFDR] < 0.05, adjusted P < 0.05, n = 4 per condition) (see gene lists in Dataset S3). (C) Number of genes that responded in a time-dependent manner (significant interaction: adjusted P < 0.05) and a time-independent manner (significant response in either of the time points and nonsignificant interaction). (D) Heatmap representation of time-dependent responsive genes in each tissue, clustered by their expression pattern. (E) Number of genes that responded to hypoxia in a time-dependent and a time-independent manner in the livers of WT and Per1,2−/− mice housed in constant dark. (OFDR < 0.05, n = 3 per condition). (F) Venn diagram representing the number of genes that significantly responded to hypoxia (both time-dependent and time-independent) in the livers of WT or Per1,2−/− mice (see gene lists in Dataset S5).

