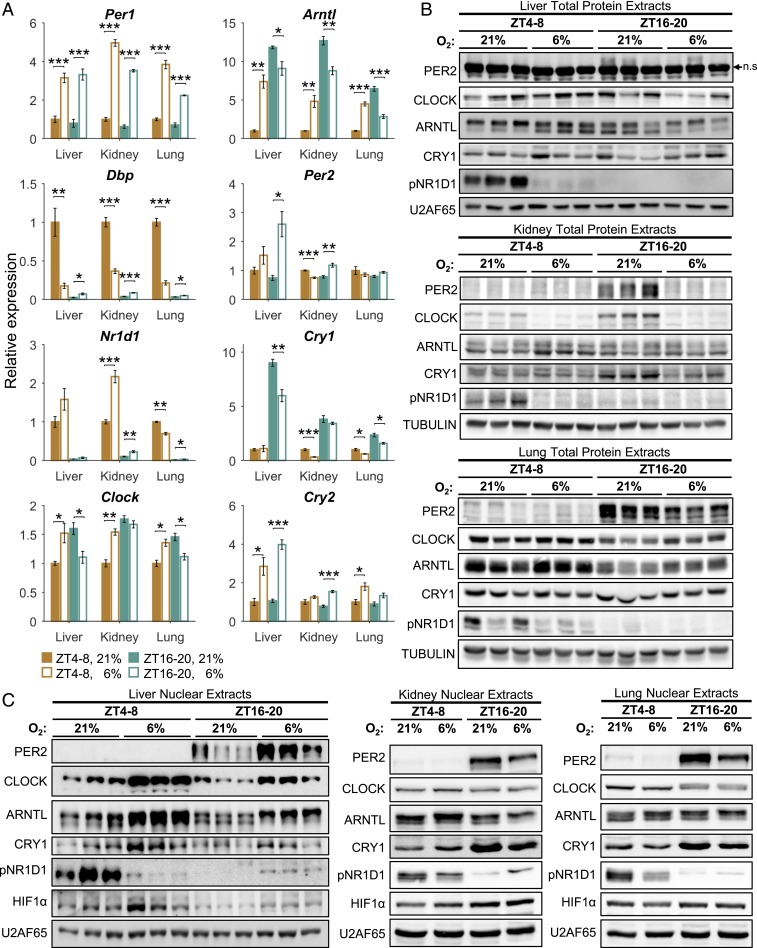
Fig. 2.
Clock-associated genes respond to acute hypoxia in a time- and tissue-specific manner. (A) qPCR analysis of clock-associated transcript levels under normoxia (21% O2) or hypoxia (6% O2) in the light (ZT 4–8) or dark (ZT 16–20) phase in different tissues (mean ± SE, n = 4 per condition; *P < 0.05, **P < 0.01, ***P < 0.001, two-sample Student’s t test). (B) Immunoblot analysis of total protein extracts from normoxic and hypoxic mice as in A (n = 3; n.s., nonspecific band). (C) Immunoblot analysis of nuclear extracts from normoxic and hypoxic mice as in A (liver: n = 3; kidney and lung: pools of n = 4).

