Fig. 4.
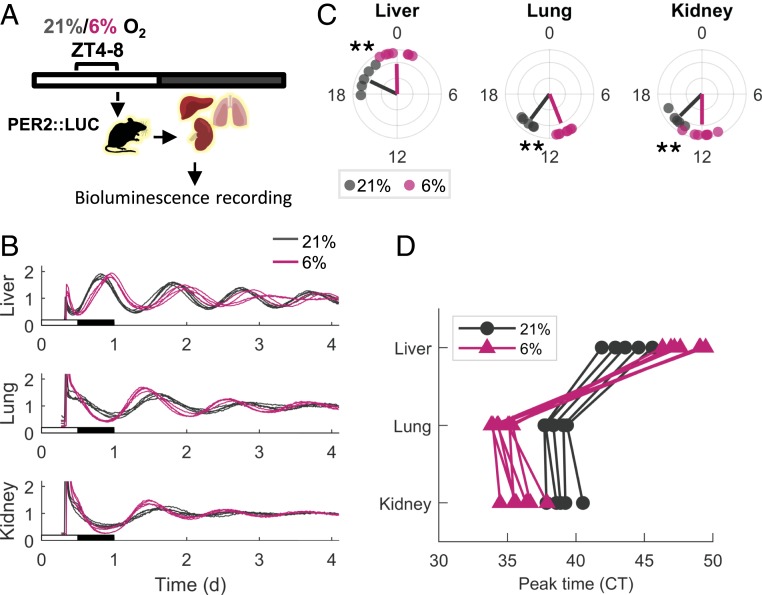
Hypoxia phase-shifts the clock in a tissue-specific manner based on PER2::LUC bioluminescence recordings. (A) PER2::LUC mice were exposed to 4 h of either hypoxia (6% O2) or normoxia (21% O2) in the light phase (ZT 4–8). Animals were killed, and tissues were harvested and sliced for bioluminescence recordings. (B) Representative relative bioluminescence plots of the PER2::LUC tissue slices (three to five slices from each mouse are shown). The x-axes are aligned with the original light–dark schedule of the mice. (C) Polar plot of the phase distribution of PER2::LUC bioluminescence. Each point represents the CT of the first peak on the second day of recordings of a single mouse (mean of three to five technical replicates). Lines’ angle represents the circular mean of each condition, and lines’ radius anticorrelates with the circular variance (n = 5 for normoxia, n = 7 for hypoxia; **P < 0.01, Watson–Williams test). (D) Phase map representation of the phase relation between tissues. Each line connects the phases of tissues from the same animal.

