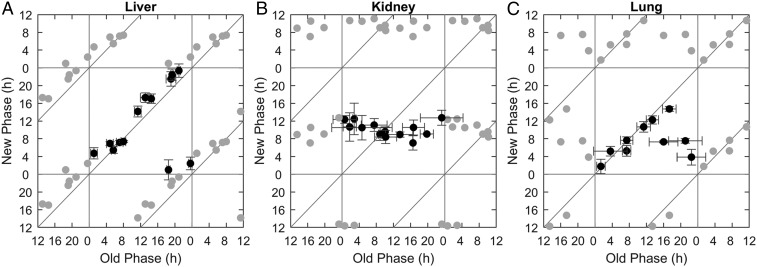
Fig. 5.
Tissue-intrinsic components differentially control the circadian clock response to hypoxia. PTCs for ex vivo hypoxia in the liver (A) the kidney (B), and the lung (C). PER2::LUC organotypic slices were cultured and exposed to hypoxia (4-h 2.5% O2) ex vivo at different times throughout the day, and their phases posttreatment were compared to those of untreated control slices (21% O2). The x-axis represents the initial phase in hours relative to the hypoxia pulse, retrieved from the control slices, and the y-axis represents the posttreatment phase, retrieved from the treated slices. Each point represents the results of one initial phase from one mouse (some mice were used for two different treatment times). Gray points are duplications of the original data for the sake of presentation (n = 9 mice for liver, n = 8 for kidney, and n = 6 for lung; mean ± SD for each axis).

