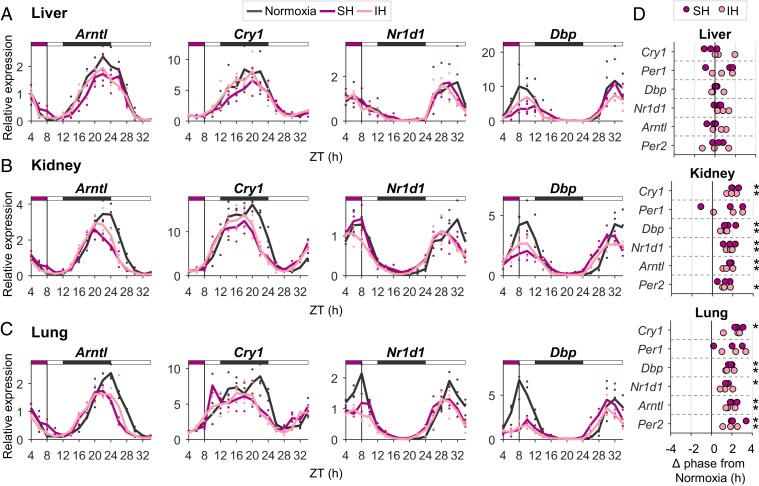
Fig. 6.
Sustained and intermittent hypoxia, as in OSA, elicits intertissue circadian clock desynchrony in vivo. Mice were exposed to 4-h sustained hypoxia (SH; 6% O2), intermittent hypoxia (IH), or normoxia (21% O2) in the light phase (ZT 4–8). Animals were killed at 2-h intervals, from ZT 4 until ZT 10 on the day after. (A–C) qPCR analysis of transcript levels of representative clock genes in the liver (A), kidney (B), and lung (C). Solid lines are averages of three biological replicates; individual replicates are marked by dots; the upper bar represents the light–dark regimen; the purple box marks the time of hypoxia. (D) Analysis of phase differences (Δ phases) in clock gene expression between SH and IH relative to normoxia. Phases were obtained using a cosine fit (*P < 0.05, paired Student’s t test, n = 3).

