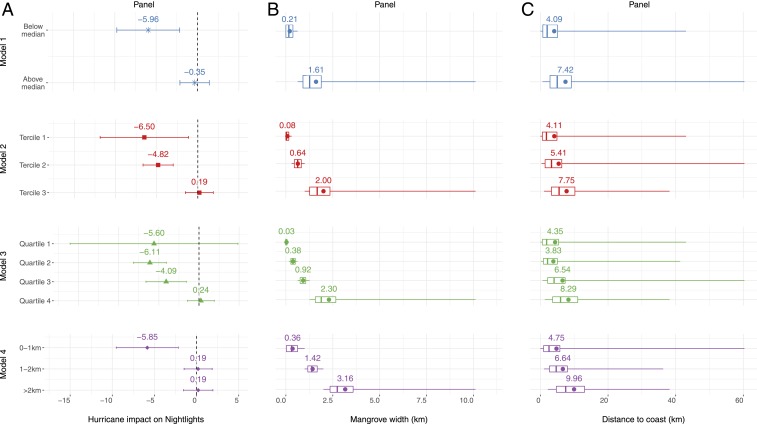
Fig. 2.
Impact of hurricanes on nightlights by mangrove width. A plots point estimates and 95% confidence intervals for 4 models. In the first 3 models, we discretize the mangrove width variable into various bins that correspond to its q quantiles and estimate the impact of hurricanes on economic activity for each bin: model 1 uses q = 2 and is labeled with stars, model 2 uses q = 3 and is labeled with squares, and model 3 uses q = 4 and is labeled with triangles. Model 4 uses bins representing 1-km steps of mangrove width and is labeled with diamonds. B plots the distribution of mangrove width for each bin, and C plots the distribution of distance to the coast for each bin. In B and C, the box represents the interquartile range, the whiskers are the minimum and the maximum, and the dot is the average value.

