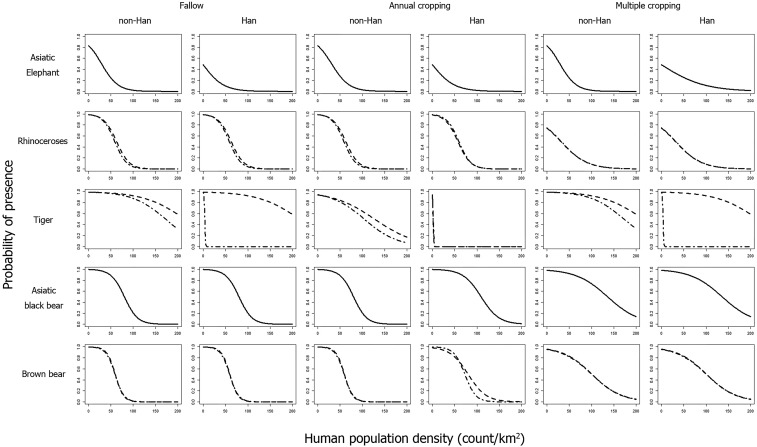
Fig. 3.
Probability of the local (scale of 100 × 100 km) presence of five megafauna taxa estimated with the models in Table 1. Solid lines indicate taxa that have only a single lowest BIC model in Table 1, while point–dash and dashed lines indicate taxa that have two effectively equally lowest BIC models in Table 1. Modeling and plotting were implemented in R software (76) using the bife package (75).

