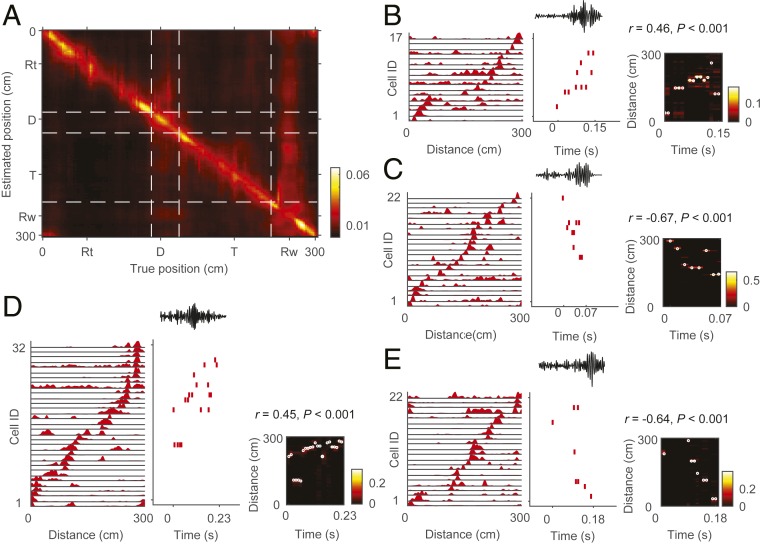
Fig. 3.
Candidate replay events. (A) Neural decoding of animal position. The heat map shows the posterior probability of estimated animal position (ordinate) ordered by the true animal position (abscissa) averaged across all sessions. Note the broad distributions of the estimated position spanning the entire maze in the reward (Rw) zone, but not in return (Rt), delay (D), or track (T) zones. (B–E) Four examples of candidate replay events for the current trajectory at the reward site. Left, a sequentially arranged neural firing-rate template for the current block; Middle, a spike raster plot during a candidate replay event along with simultaneously recorded local field potential (LFP) signals (filter, 100 to 250 Hz) on top; Right, a heat map of reconstructed position for each event. White circles show the reconstructed position with maximum probability. The numbers above each plot show the weighted correlation (r) and P value (SI Appendix, Materials and Methods) for each event.

