Fig. 3.
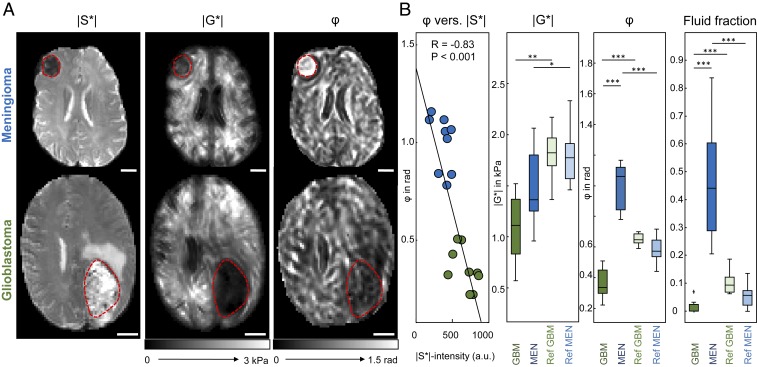
In vivo MRE of brain tumors. (A) Two representative cases of MRE in GBM and MEN illustrating basic differences in T2*/T2-weighted MRI signal intensity (magnitude signal of the MRE scan, |S*|), magnitude shear modulus (|G*|), and phase angle of the shear modulus (φ). (Scale bar: 20 mm.) Red dashed lines demarcate tumor regions. (B) Quantitative analysis with correlation analysis of MRE-measured fluidity φ versus T2*/T2-weighted MRI signal intensity (|S*|). |S*| indicates the relative amount of free water inside the tumor, which is negatively correlated with fluidity φ. Group statistical plots of |G*|, φ, and the fluid fraction, that is, the fraction of intratumoral tissue with φ > π/4, are shown for tumors (GBM and MEN) and normal-appearing reference tissue (denoted as Ref GBM and Ref MEN). *P < 0.01, **P < 0.001, ***P < 10−4.

