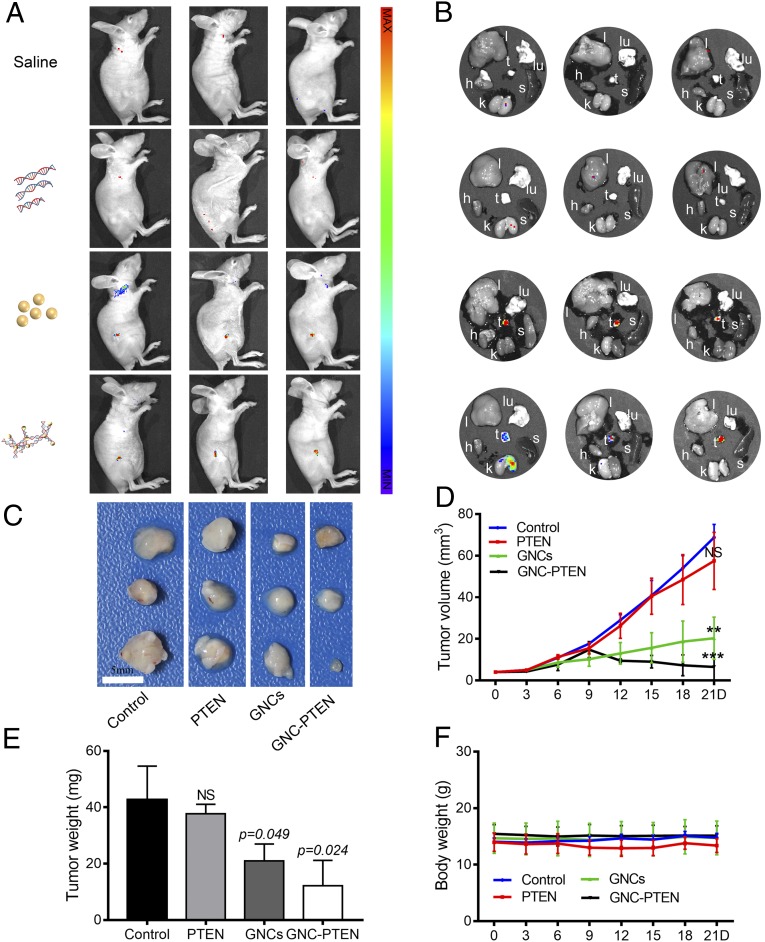
Fig. 6.
The antitumor effects of the GNC-PTEN complexes in s.c. tumors. (A) Fluorescent images 12 h after the last injection in the 4 groups of mice [excitation wavelength (ex): 420 nm, emission wavelength (em): 620 nm]. From top to bottom: control, PTEN, GNC, and GNC-PTEN complex groups. (B) Ex vivo imaging of major organs (l, liver; k, kidney; s, spleen; lu, lung; and h, heart) and tumors (t, tumors) in corresponding photograph of each mouse shown in A (ex: 420 nm, em: 620 nm). (C) Tumor images on day 21. (Scale bar, 5 mm.) (D) Tumor sizes measured within 21 d. Compared with the control group, the significant difference in the last measurement of the 3 groups is marked in the figure. (E) Weight of the isolated tumors. (F) Weight of each group of mice. NS, no significant difference. **P < 0.01, ***P < 0.001.

