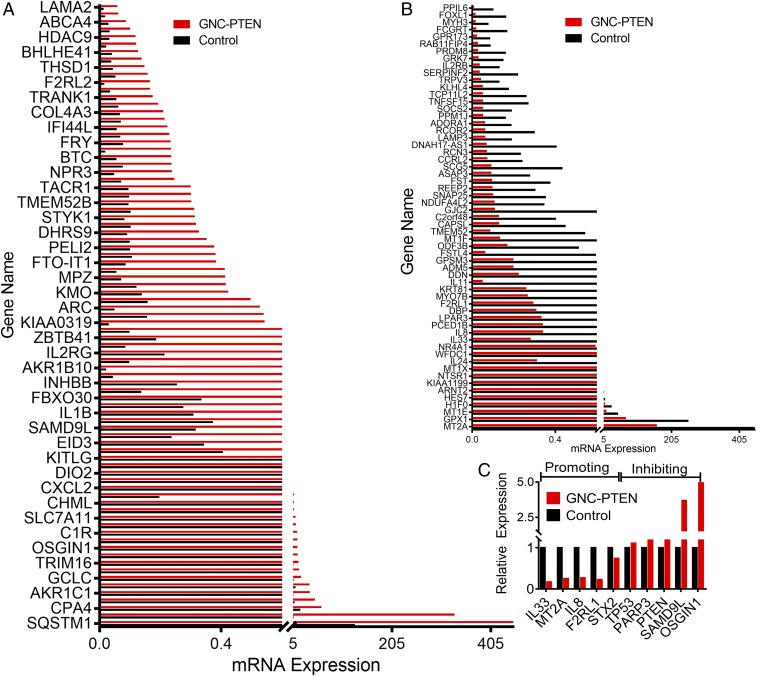
Fig. 7.
Differential expression of mRNA levels in the self-assembled GNC-PTEN complex group compared with the control group. (A) Up-regulated and (B) down-regulated genes in the GNC-PTEN complex group. (C) Oncogene and tumor suppressor gene expression in the self-assembled GNC-PTEN complex group compared with the control group. The expression of the control group was standardized to 1.

