Fig. 3.
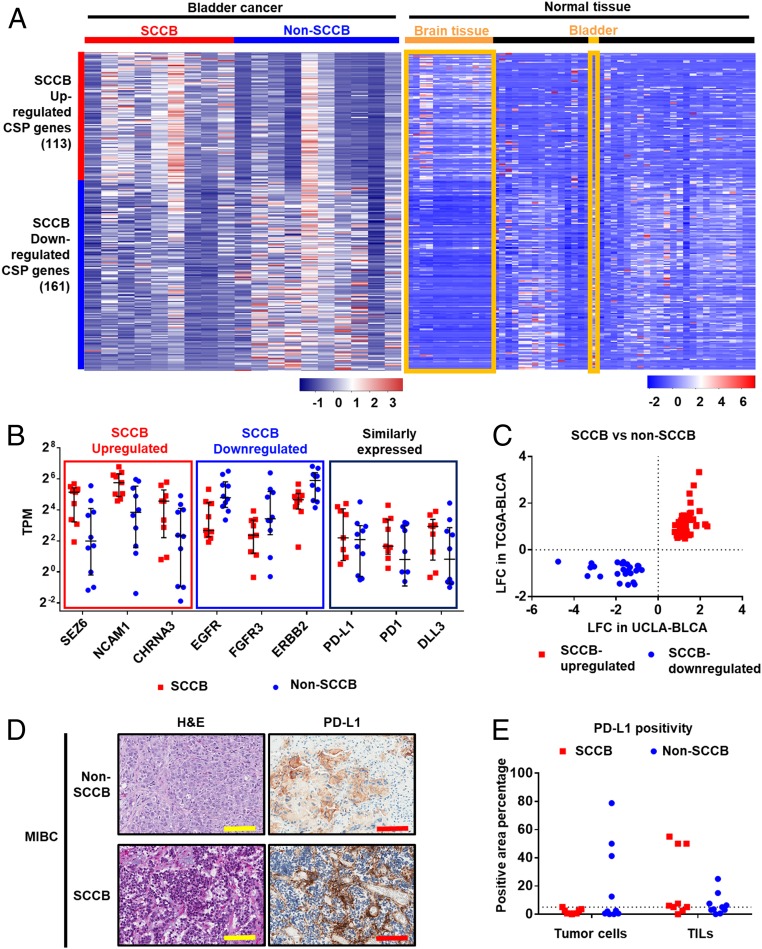
Profiling CSP genes identifies CSPs associated with SCCB and the expression of PD-L1 in SCCB samples. Transcriptional analyses profile CSPs genes in samples from the UCLA-BLCA cohort. (A) A heatmap shows CSP genes differentially expressed in SCCB and non-SCCB samples from the UCLA-BLCA cohort and their expression levels in normal tissues. Data are shown by the z-score normalized by genes across samples (Left) or tissues types (Right) based on the TPM of each sample (Left) or the median TPM of a tissue type (Right). Each row represents a gene in both panels. In the Left, each column represents a sample from the UCLA-BLCA cohort. In the Right, each column represents a tissue type from GTEx database. Brain tissues and bladder tissues are highlighted. Red color indicates higher expression level (higher z-score); blue color indicates lower expression level (lower z-score). Scale bar indicates the z-score. (B) mRNA expression level of selected CSP genes in each group. The SCCB up-regulated or SCCB down-regulated CSPs have P < 0.05 in the DESeq2 analysis (suggesting significantly up-regulated or down-regulated in SCCB samples comparing to non-SCCB samples.) The similarly expressed CSPs have a P value >0.05 in the DEseq2 analysis. The TPM of each sample is shown. Each dot represents a sample with corresponding phenotype. The median and interquartile range are shown. Samples with a TPM less than 0.125 is not shown in the figure. (C) A plot of LFC in UCLA-BLCA and TCGA datasets showing the LFC of CSP genes that are differentially expressed in both the UCLA-BLCA dataset and the TCGA dataset. Each dot represents a CSP gene. CSPs have been prefiltered for P < 0.05 in both UCLA-BLCA and TCGA-BLCA datasets in DESeq2 analysis comparing SCCB versus non-SCCB samples. (D) Representative images of H&E and IHC using a Food and Drug Administration-approved PD-L1 antibody (Ventana SP-142) showed PD-L1 expression in non-SCCB and SCCB sample. (Scale bars, 100 μm.) (E) Quantification analysis of PD-L1 IHC staining in the UCLA-BLCA cohort. Data are shown by the percentage of PD-L1 staining positivity in tumor cells and TILs in non-SCCB and SCCB samples. Each dot represents a sample of given phenotype. The dot line shows 5% positivity. No statistical significance is observed between SCCB and non-SCCB samples in tumor cell or TILs (Student t test).

