Fig. 4.
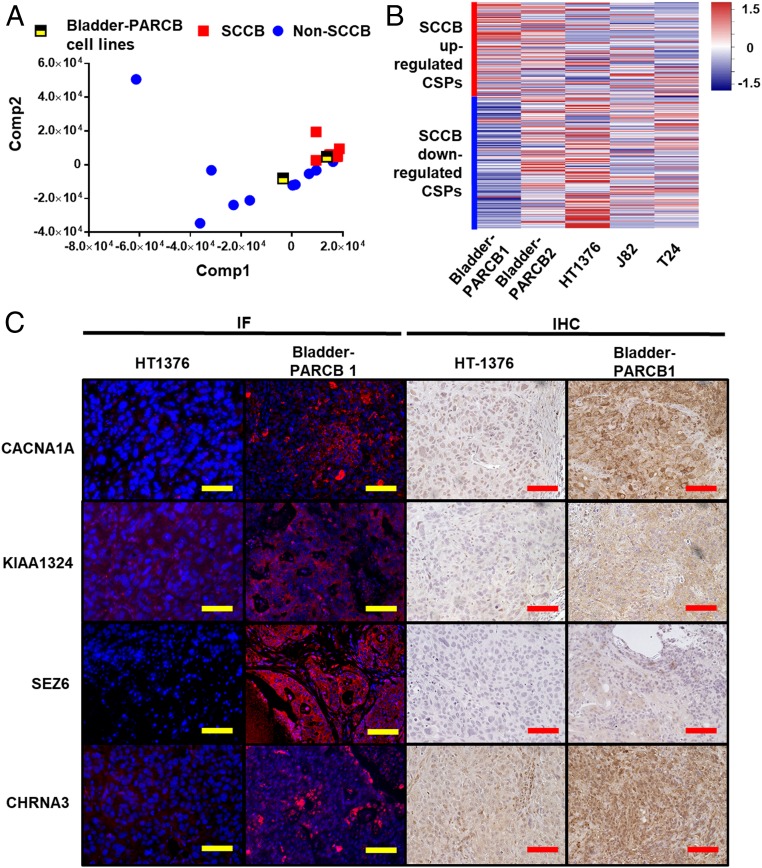
Bladder-PARCB cell lines share similar CSP profile with clinical SCCB samples. Bladder-PARCB cell lines express SCCB-associated CSPs at mRNA and protein levels. (A) PLSR projecting the CSP transcriptional profile of bladder-PARCB cell lines to the UCLA-BLCA cohort. The bladder-PARCB1 cell line is clustered with clinical SCCB samples. (B) Heatmap summarized the expression of phenotype-associated CSPs in bladder-PARCB cell lines and urothelial carcinoma cell lines NCI-HT1376, J82, and T24. Data are shown by the z-score normalized by genes across cell lines based on the TPM of genes in each cell line. Each row represents a gene. Red color indicates higher expression level (higher z-score); blue color indicates lower expression level (lower z-score). (C) Representative image of IF or IHC using antibody against CACNA1A, KIAA1324, CHRNA3, and SEZ6 in tumor derived from HT-1376 and PARCB cell lines. In the IF panel, blue color shows nuclear staining by DAPI, red color indicates positivity of CSPs. (Scale bars, 100 μm.)

