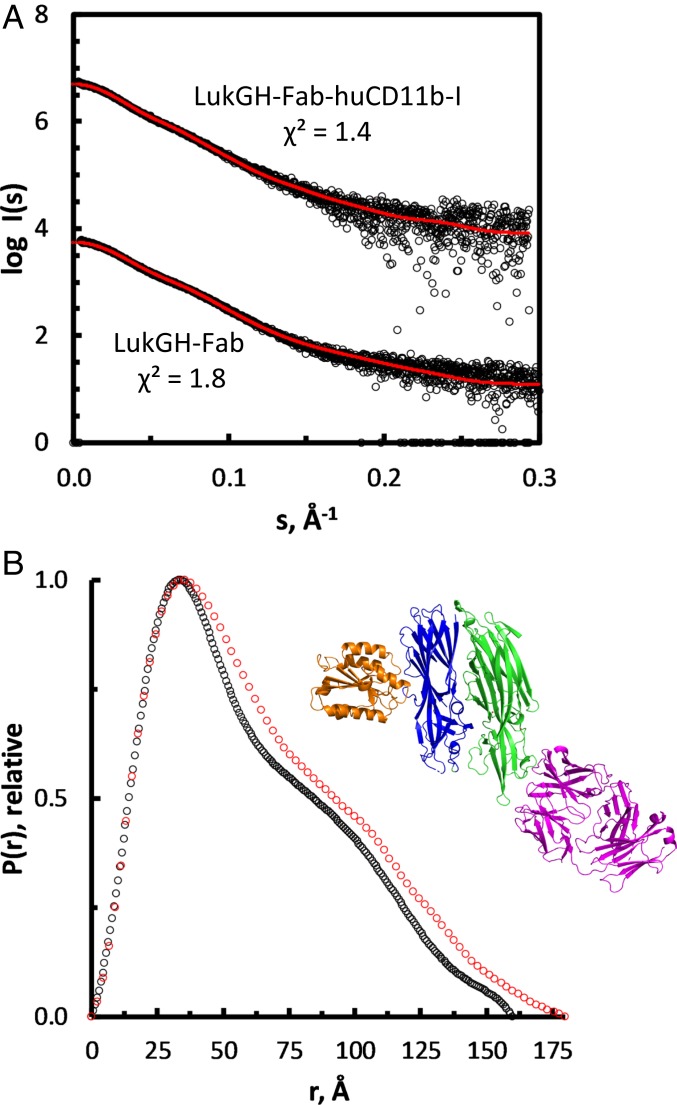
Fig. 4.
SAXS analysis of complex formation. (A) Scattering data as logI(s) vs. s plot compared to the theoretical scattering of the respective models. These comprise the interfaces as retrieved from the crystal structures; χ2 values are indicated. Curves are shifted along the y axis for better visualization. (B) Distance distribution profile of LukGH-Fab (black) and LukGH–Fab–huCD11b-I (red). The Inset shows the expected complex formation as cartoon representation, with the LukG, LukH, huCD11b-I, and Fab subunits in green, blue, orange, and purple cartoons, respectively.

