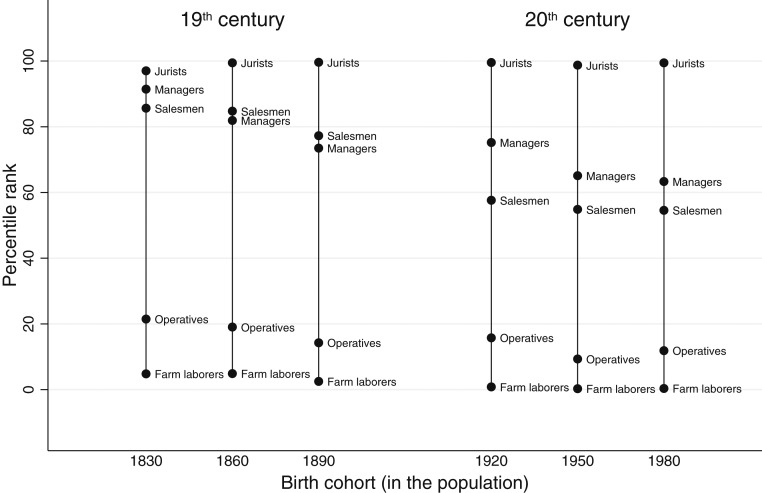
Fig. 1.
Trends in occupational percentile ranks among select occupations. Data sources: IPUMS US Population Censuses full count 1850, 1880, 1900, 1910, 1920, 1930, 1940; 1% samples 1860, 1870, 1950; 5% samples, 1960, 1980, 1990, 2000; 6% sample, 1970; ACS 2001–2015. Notes: The figure shows changes in percentile ranks for 5 out of the 70 microclass occupations defined in SI Appendix, Table S1. The percentile ranks are estimated from occupation-specific educational distributions by birth cohort using all men and women aged 25 to 64 in population censuses. The methodology is described in SI Appendix, section S4. Percentile rank changes for all of the birth cohorts and microclass occupations are shown in SI Appendix, Fig. S1. The graph suggests that distances between top-ranked occupations, such as between jurists and managers, have increased over time because of the growth of professional, managerial, and upper nonmanual occupations at the top end of the distribution.

