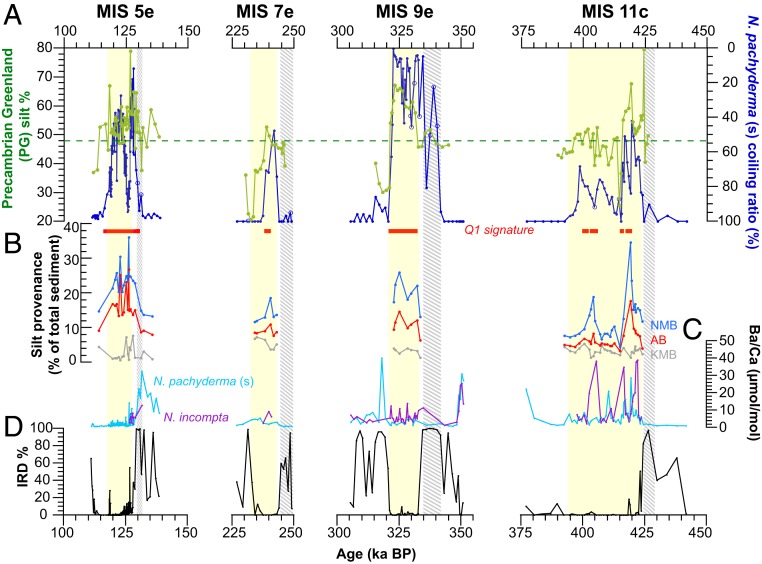
Fig. 2.
Comparison with GIS discharge records. (A) Modeled PG percentage silt contributions (green) from Core MD99-2227 plotted together with N. pachyderma (s) coiling ratio (percentage; dark blue) from Sites MD03-2664 (10, 43) and U1305 spanning the last 450 ka. Open circles [in N. pachyderma (s) coiling ratio] mark samples with low (<150) total number of planktonic foraminifera. Duration of quadrant 1 (Q1) signatures (red bars) is used by Hatfield et al. (9) to mark intervals with strongest PG sourcing when silt wt % > 45% and PG% > 48%. The dashed green line in PG percentage marks 48%. (B) Silt provenance records expressed as percentage of total sediment derived from south Greenland’s 3 Precambrian bedrock terranes (i.e., from south to north: Ketilidian Mobile Belt [KMB; gray], Archean Block [AB; red], and Nagssugtoqidian Mobile Belt [NMB; blue]) from Eirik Drift Core MD99-2227 (6, 8, 9). (C) N. pachyderma (s)-derived (light blue) and N. incompta-derived (purple) Ba/Ca. (D) IRD percentage from Sites MD03-2664 (10, 43) and U1305 spanning the last 450 ka. Yellow shading marks the interglacial benthic δ18O plateaus. Gray (cross-hatched) shading marks deglacial IRD peaks (Heinrich events).

