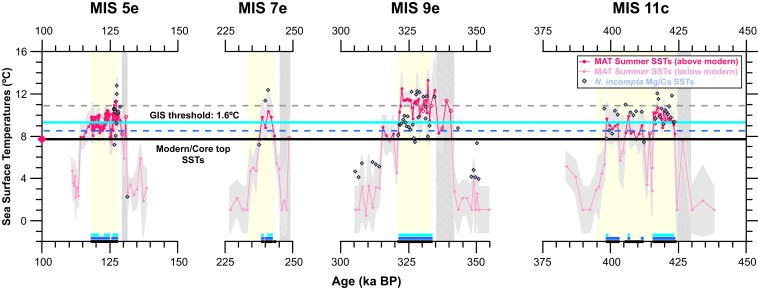
Fig. 3.
GIS thresholds. MAT summer and N. incompta Mg/Ca SSTs (light purple diamonds) spanning the last 450 ka. The pink diamond and the black bold line mark the modern/core top MAT summer SST (7.7 °C) from the Eirik Drift Multicore GS06-144-03 MC A (SI Appendix). MAT summer SSTs above modern temperature are shown in dark pink, and MAT summer SSTs below modern temperature are shown in light pink. Light gray shading marks the uncertainty (i.e., the SD of the estimates from the top 5 analogs) in MAT summer SSTs. Open circles mark samples with low (<150) total number of planktonic foraminifera. Yellow shading marks the interglacial benthic δ18O plateaus. Gray (cross-hatched) shading marks deglacial IRD peaks (e.g., Heinrich events). The bold light blue line and the dashed blue and gray lines mark the modeled global mean temperature threshold for the GIS collapse (1.6 °C) and its range (0.8 to 3.2 °C), respectively (16). Black, dark blue, and light blue bars (along the bottom) mark the durations of MAT summer SSTs above modern, 0.8 °C threshold, and 1.6 °C threshold, respectively.

