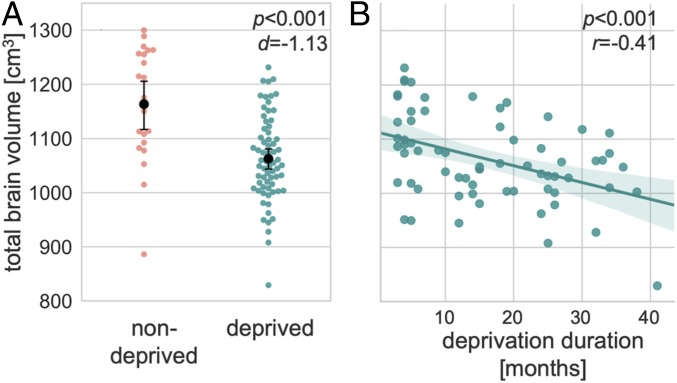
Fig. 1.
Deprivation-related differences in TBV. (A) Point and swarm plot depicting distributions of TBV in deprived and nondeprived groups (n = 88). Black whiskers show 95% CIs around the means (black dots). (B) Negative correlation between deprivation duration and TBV (n = 67). The shaded area depicts the 95% CI around the regression line. These analyses were adjusted for the effects of sex. Effect sizes were calculated with Cohen’s d and Pearson’s r.

