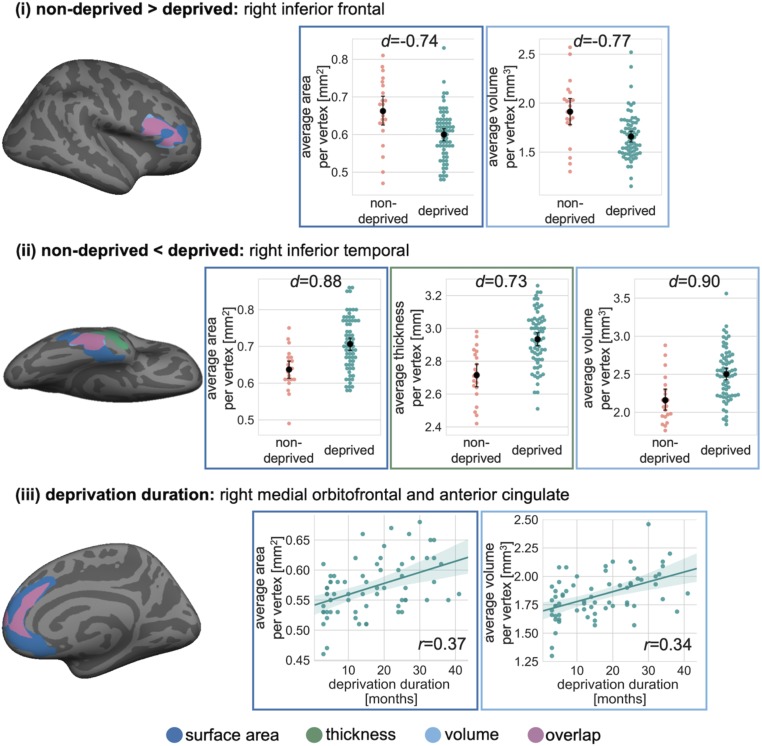
Fig. 2.
Deprivation-related regional differences in cortical volume, thickness, and surface area. (Top) Relative to nondeprived UK adoptees, the deprived Romanian adoptees had smaller surface area and volume in a cluster in the right inferior frontal gyrus. (Middle) The deprived Romanian adoptees had greater cortical thickness, surface area, and volume in a cluster in the right inferior temporal gyrus. (Bottom) There was a positive correlation between deprivation duration and cortical surface area and volume of the right medial prefrontal cortex. This cluster included the right superior frontal, medial orbitofrontal, and anterior cingulate cortices. Brain maps are displayed in Left. Point and swarm plots in Right display averages of vertexwise measures of each cluster, with dots representing individual participants (n = 88). Black whiskers show 95% CIs around the means (black dots). All clusters were significant on a whole-brain level following correction for multiple comparisons (clusterwise threshold P < 0.05). Effect sizes (Cohen’s d and Pearson’s r) of each cluster were derived from whole-brain vertexwise effect size brain maps. All analyses included TBV (except cortical thickness) and sex as covariates. Individual data points represent measures after regressing out these covariates.

