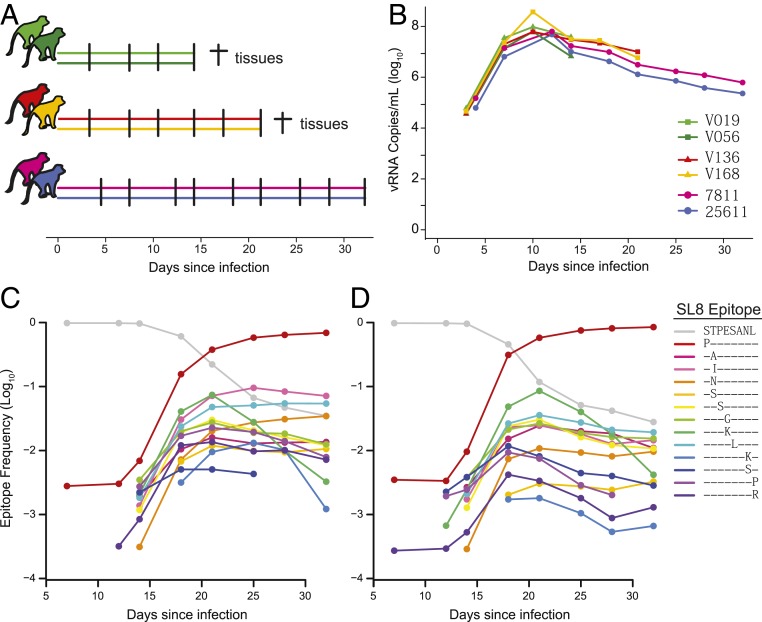
Fig. 1.
Viral replication and immune escape in plasma. (A) Six animals were infected i.v. with 220,000 IU SIVmac239M on day 0 and followed for up to 32 d. Two animals were necropsied each on day 14 and day 21 with spleen, lymphoid, and GI tissues collected for sequence analysis. (B) Viral RNA copies were measured in the plasma of each animal. (C and D) The relative frequencies (log10) of wild-type (gray line) and all major Tat-SL8 escape mutants (reaching at least 1% frequency in either animal; colored lines) are shown for animals 25611 (C) and 7811 (D) at various sampled time points. Protein sequences of the escape mutations are shown in the keys. Frequencies below the determined limit of detection of each escape mutant are not shown.

