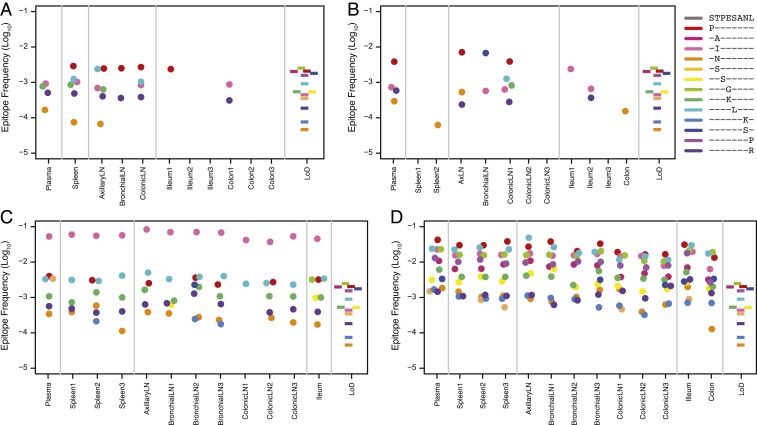
Fig. 2.
Immune escape in tissues. Shown are the relative frequencies (log10) of the predominant Tat-SL8 escape mutations (colored circles) (A–D) above the limit of detection in tissues for each necropsied animal. The protein sequences of the escape mutations are shown in the keys. The colored bars in the rightmost panels depict the range of sequencing error specific to each amino acid change among 6 replicates.

