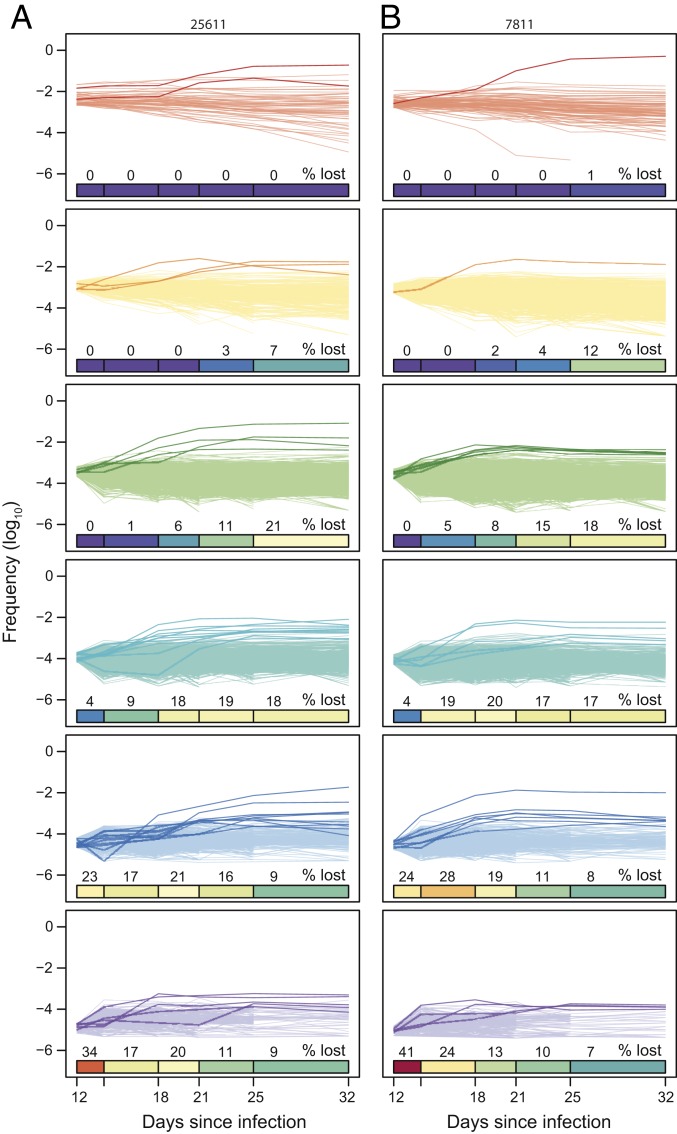
Fig. 5.
The longitudinal dynamics of barcode lineages during immune selection. The relative frequencies (log10) of barcode lineages are shown over time for animals 25611 (A) and 7811 (B) partitioned based on their peak viral loads at day 12. The color coding demarcates 0.5 log10 intervals in viral load between 5.0 and 3.0 log10. The heat bars show the cumulative percentage of barcodes that are lost to detection over time. Barcode lineages that increase at least 10-fold in relative frequency between day 12 and day 21 are highlighted by thicker and darker lines.

