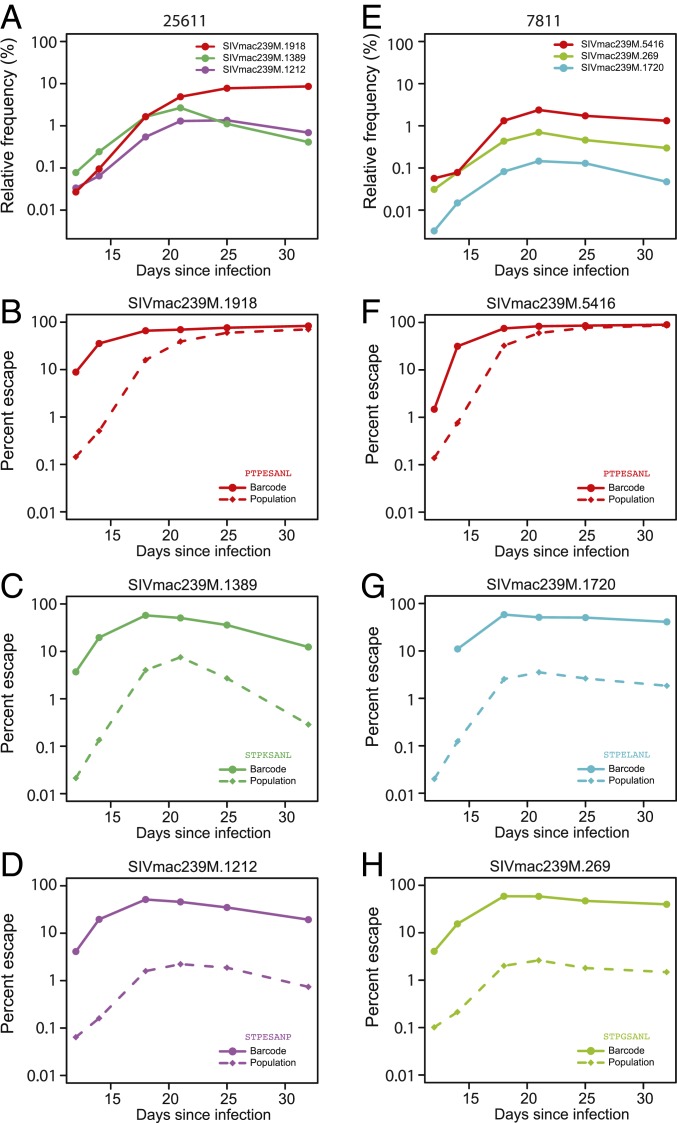
Fig. 6.
The dynamics of barcode lineages reflect the underlying dynamics of escape. Shown are the relative frequencies of select barcode lineages for animal 25611 (A) and animal 7811 (E). The color of the lines corresponds to the predominant escape mutation in each barcode, with each amino acid change indicated in B–D and F–H, respectively. The relative frequencies of the predominant escape mutation within each barcode lineage (solid lines) and in the virus population overall (dashed lines) are shown for animal 25611 (B–D) and animal 7811 (F–H).

