Fig. 1.
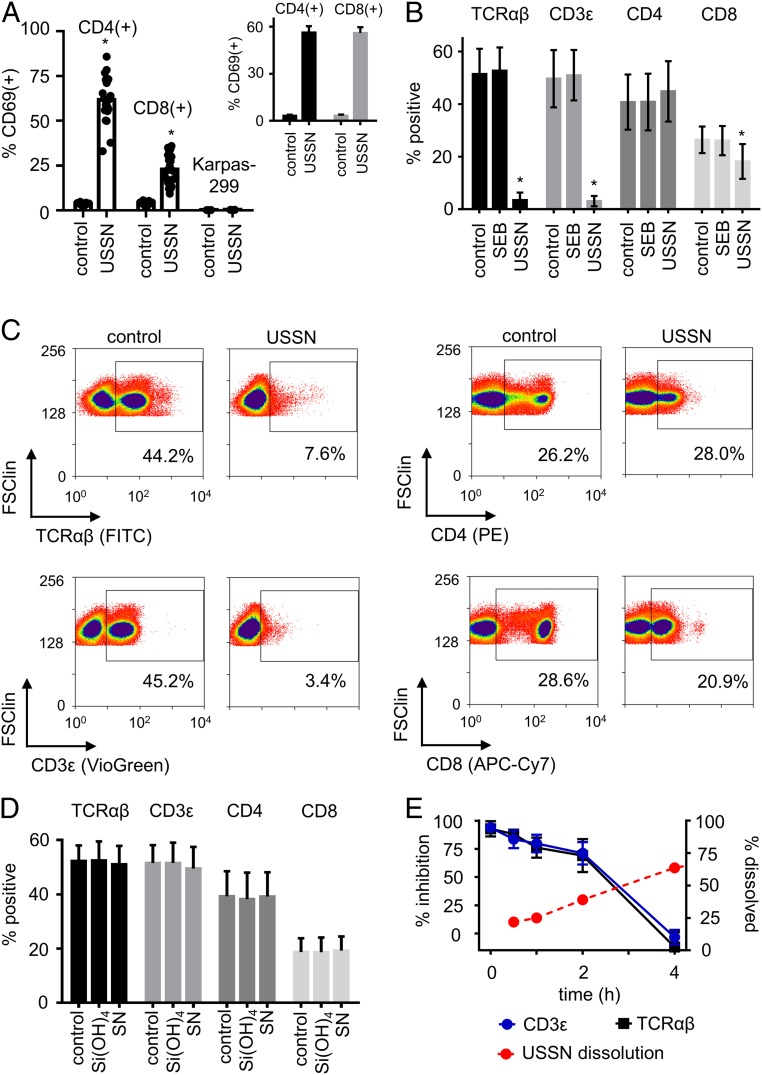
T cell activation and TCR complex targeting by USSN. (A) CD69 expression on PBMC-residing CD4 and CD8 T cells, and on the Karpas-299 T cell line, with vehicle-only stimulation (control) or in response to 800 μM USSN. Cells were in RPMI media containing 10% FBS. Data represent the means ± SD for 23 different donors (CD4 and CD8 T cells) or for 3 independent replicates (Karpas-299). (Inset) CD69 expression on PBMC-residing CD4 and CD8 T cells with vehicle-only stimulation (control) or in response to 800 μM USSN in RPMI media containing 4% BSA. Data represent the means ± SD for 3 different donors. (*P < 0.05, denotes significance compared to the control, paired t-test.) (B) Percentage of cells positive for TCR, CD3, CD4, and CD8 within a T cell gate after treatment with vehicle, SEB, or 800 μM USSN for 5 min. Data represent the means ± SD for 4 donors (*P < 0.05, denotes significance compared to the control, paired t-test). (C) Representative flow cytometry plots showing the expression of TCR, CD3, CD4, and CD8 on cells within a T cell gate after treatment with vehicle or 800 μM USSN for 5 min. (D) Percentage of cells positive for TCR, CD3, CD4, and CD8 within a T cell gate after treatment for 10 min with either dissolved silica [Si(OH)4, at 800 μM] or with 800 μM silica nanoparticles (SN) just outside of the ultrasmall size range (DV0.5 = 14.1 ± 1.4-nm diameter). Data represent the means ± SD for 4 different donors. (E, Left y axis) Percent inhibition of TCR and CD3 within a T cell gate after treatment with 800 μM USSN for 0.1 to 4 h. Means ± SD for 4 donors. Right y axis shows the percent dissolution of 800 μM USSN in the media at 37 °C as abstracted from SI Appendix, Fig. S1C. Means ± SD for 3 replicates.

