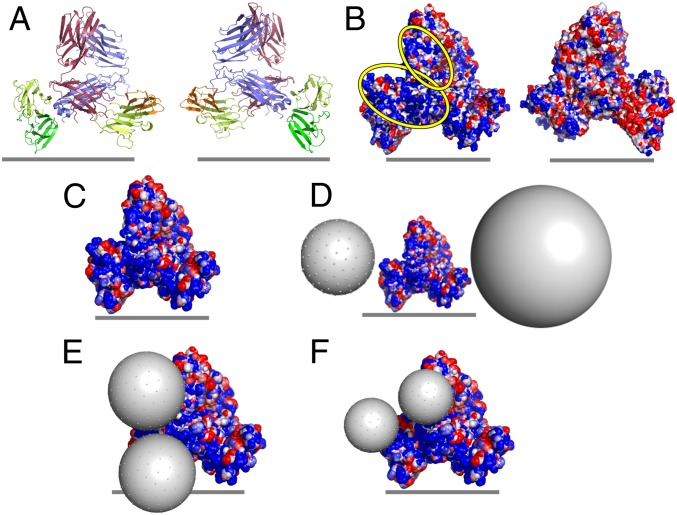
Fig. 2.
The electrostatic potential of the TCR:CD3 complex surface and potential interfaces for USSN binding. (A) Ribbon representations of the modeled human TCR:CD3 complexes: red, TCRα chain; blue, TCRβ chain; orange, CD3δ chain; yellow, CD3ε chain; green, CD3γ chain. (B) Molecular surface representation of electrostatic potential (calculated by Bluues) for modeled human TCR:CD3 complexes. Electrostatic surfaces are shown over a range of ±2 kJ/mol q, with blue representing electropositive and red representing electronegative. Electropositive regions of interest are highlighted with yellow ovals. The Left and Right images in A and B represent front and back views of the receptor complex, related by a 180° rotation around the vertical axis, and the gray lines represent the approximate location of the cell membrane. (C) Electrostatic potential of the solvent-accessible surface of the human TCR:CD3 complex (colored as in B). (D–F) Theoretical representation of the potential interaction between the human TCR:CD3 complex and USSN, with USSN diameter = (D) 8 and 15 nm, (E) 5 nm, and (F) 3.6 nm.

