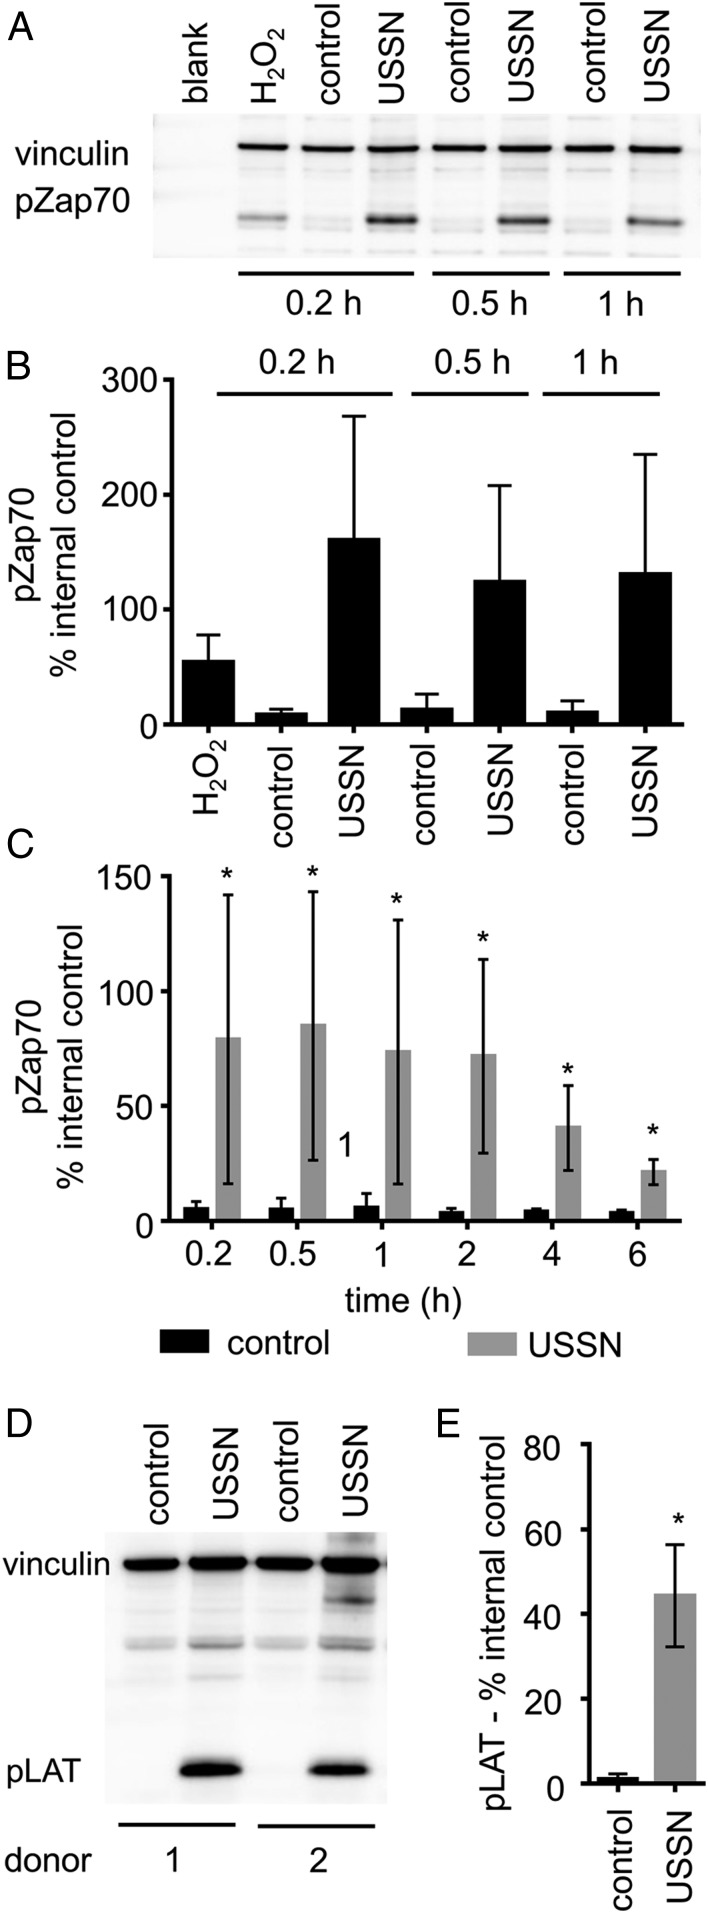
Fig. 3.
The effect of USSN on the phosphorylation of Zap70 and LAT in T cells. (A) A representative immunoblot of cultures stimulated for 0.2 to 1 h, showing the effect of 800 μM USSN on the phosphorylation of Zap70 in Jurkat cells. Blots were probed with antibodies to detect pZap70 (at Tyr319, protein ∼70 kDa) and vinculin (protein ∼128 kDa). (B) Percentage of pZap70 band volume compared to the vinculin band control at 0.2 to 1 h. Western blot data represent the means ± SD for 3 independent replicates. (C) Percentage of pZap70 band volume compared to the vinculin band control at 0.2 to 6 h in enriched T cell cultures. Western blot data represent the means ± SD for 6 different donors (*P < 0.05, denotes significance compared to the control, paired t-test). (D) A representative immunoblot of cultures stimulated for 0.2 h, showing the effect of 800 μM USSN on the phosphorylation of LAT in enriched T cells. Blots were probed with antibodies to detect pLAT (at Tyr191, protein ∼37 kDa) and vinculin (protein ∼128 kDa). (E) Percentage of pLAT band volume compared to the vinculin band control at 0.2 h in enriched T cell cultures. Western blot data represent the means ± SD for 6 different donors (*P < 0.05, denotes significance compared to the control, paired t-test).

