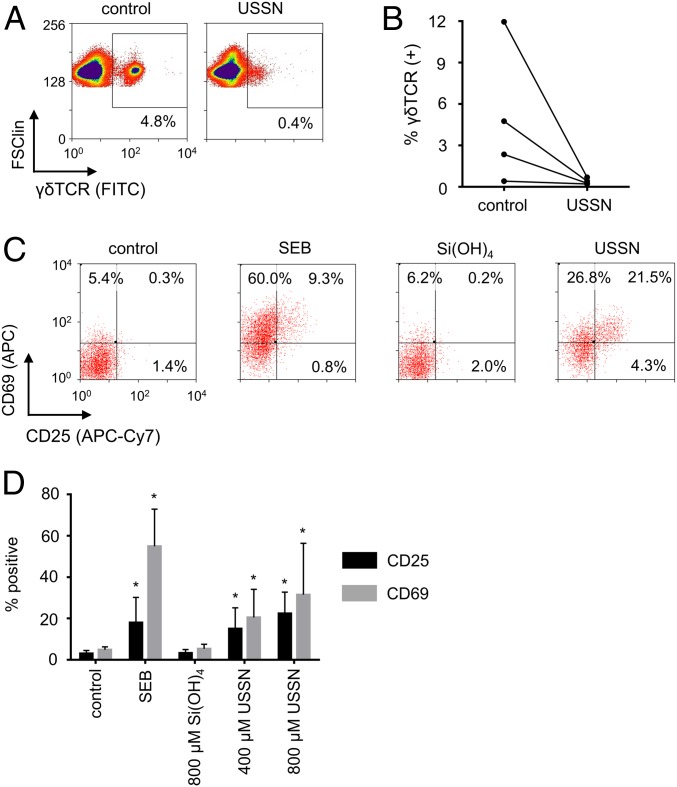
Fig. 4.
The cellular impact of USSN on γδ T cells. (A) Representative flow cytometry plots showing the expression of γδ TCR on cells within a T cell gate after treatment with 800 μM USSN for 10 min. (B) Percentage of the cells positive for γδ TCR within a T cell gate after treatment with 800 μM USSN for 4 donors after 10 min. (C) Representative bivariate dot plots showing expression of CD25 and CD69 on γδ T cells with differing stimulants. (D) Percentage of PBMC-residing γδ T cells that are positive for CD25 and CD69 after 24 h with differing stimulants. Data shown represent the mean ± SD for 8 donors (*P < 0.05, denotes significance compared to the control, 2-tailed paired t-test).

