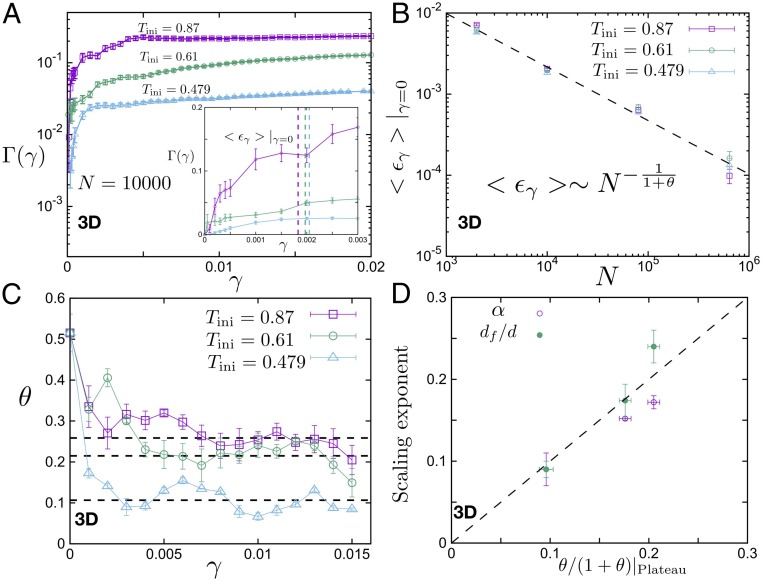
Fig. 5.
The mean value of first avalanche event strain. (A) versus for in a 3D system. (A, Inset) Zooming in vs. curve for different thermal histories, the vertical line shows the mean value of first avalanche event strain ; from left to right is , respectively. (B) versus system size for different thermal histories in the 3D system. The dashed line is where the exponent is fitted to the data. (C) Evolution of with the strain window for different thermal histories. The dashed line is the mean value of over the interval . We define this value as the plateau value, from top to bottom, for , respectively. (D) Correlation between finite-size scaling exponents , and the exponent in the 3D system.

